New NDA Infographic highlights state of drug approvals in 2014: EU vs USA
Posted: 6 May 2015 |
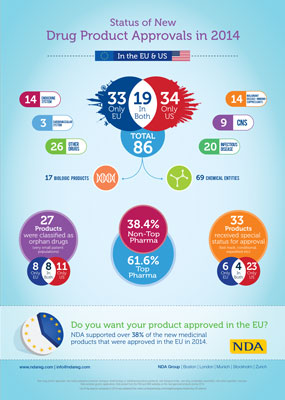
NDA Group’s new Infographic looks at drug approvals in 2014 and highlights the fact that nearly 40% of approved products came from non top pharma companies…


Drug Approvals Infographic EU vs USA 2014 CREDIT: NDA Group
NDA Group has launched a new Infographic which highlights the state of drug approvals in Europe and the USA in 2014.


Drug Approvals Infographic EU vs USA 2014 CREDIT: NDA Group
Key findings include the fact that nearly 40% of approved products came from non top pharma companies. Also, while the same number of drugs were approved in the US and EU in 2014, drug approval was 174 days faster in the US than in the EU.
NDA Infographic draws on data released from the EMA and FDA on drug approvals
The new Infographic draws on official data released from the European Medicines Agency (EMA) and the US Food and Drug Administration (FDA), and focuses in on the following key findings:
- The differences in drug approvals between the USA (FDA) and the EU (EMA)
- Break-out results by therapeutic areas
- Compares the time taken to get drugs approved, and shows the significant difference in drug approval times between the EU and the US
- Shows the percentage of top pharma vs non top pharma in gaining drug approvals
- Breaks-out those that received ‘Special Status’ in the EU and the USA
The data outlined in the Infographic has been analysed by NDA in a new article.
2013 vs 2014 data
This is the second year NDA has gathered this data and created a comparative infographic to show changes in the industry. To see the findings of last year’s infographic, please visit www.ndareg.com/drug-approvals-infographic.
Some interesting comparatives between the two years (2013 and 2014) include:
- 86 products were approved in 2014 compared to 84 in 2014
- Of those approved, more were from chemical entities this year (69 in 2014 vs 57 in 2013), but fewer biologics (2014 had 17 compared to 27 in 2013)
Related organisations
European Medicines Agency (EMA), Food and Drug Administration (FDA), NDA Group


