LC-MS based multi-attribute method for characterisation and QC testing of protein therapeutics
Posted: 2 November 2018 | Ioannis A. Papayannopoulos (Celldex Therapeutics Inc.) | 2 comments
For several decades mass spectrometry (MS) has been used in the characterisation of protein pharmaceuticals.1-3 However, its use in the laboratory for quality control (QC) product release testing has been quite limited for a number of reasons, for example: instrument complexity and software are not readily amenable to validation, extensive training requirements are needed for instrument operators, there is difficulty in generating comprehensive standard operating procedures (SOPs), and finally the price of the equipment. Additionally, there has been a tendency to diminish the importance of the information obtained from the mass spectrometric data as being redundant to and not always consistent with the information generated from the data of traditional product release assays.


During the past decade, significant improvements have been made in mass spectrometers, not only in their performance (increased resolution, higher mass accuracy, greater stability, speedier data acquisition) but also in streamlining their manufacture and, importantly, their maintenance and serviceability. Furthermore, instrument control and data analysis software have become much more powerful and easier to use. Instrument tuning and calibration, the parameters for which had to be entered and adjusted by highly trained and experienced operators while monitoring the mass spectrometer response, have been automated and are fully software-controlled. All this has made validation of mass spectrometers for the analysis of biotherapeutics easier. Additionally, there have been significant improvements in chromatography, with high pressure systems utilising columns with sub-2micron particles with innovative chemistries, all of which result in faster, higher performance separations, going hand-in-hand with improved MS instrument and software capabilities. Finally, sample preparation (reduction and alkylation, desalting, enzymatic digestion) has also become streamlined and highly reproducible, with standardised high-quality reagents (eg, mass spectrometry-compatible detergents, trypsin and other enzymes), sample cleanup devices (eg, molecular weight centrifugal filters) and equipment (eg, temperature control units). In fact, the entire sample preparation process can be ported to a liquid handling workstation controlled by software and integrated with the LC-MS system used for analysis. Documentation and auditing have become both convenient and robust.
The greater facility in generating highly reproducible samples and obtaining from them reproducible and quantitative high-quality MS data has reinforced the concept that many of the product quality attributes (PQAs), typically ascertained from measurements using a variety of chromatographic and electrophoretic methods, could be readily obtained from the MS data alone and with detail on the molecular level often not discernible with traditional methods. This is in alignment with the Quality by Design (QbD) approach to the development of pharmaceuticals, which is advocated by the regulatory agencies and which is being adopted by biopharmaceutical companies. QbD is predicated on extensive understanding on the molecular level of features that are important for safety and efficacy.
LC-MS-based MAM
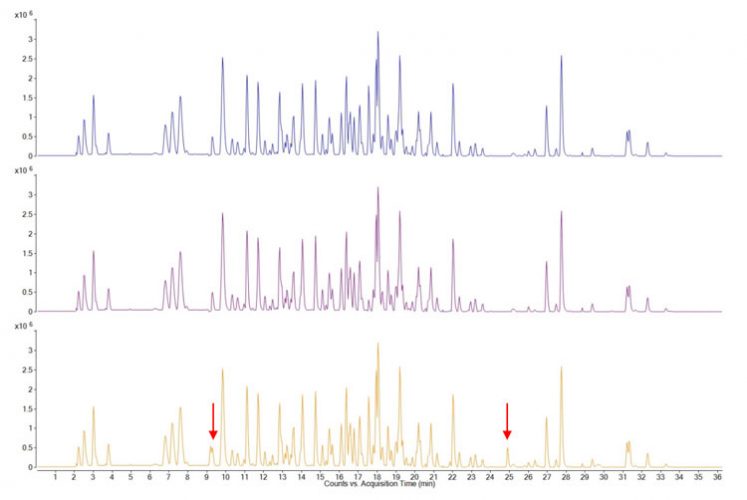
Multi-attribute Method (MAM) is a mass-spectrometry (or, more accurately, LC-MS) based method used to quantify many product quality attributes that would have been typically measured with several different chromatographic or electrophoretic methods.5-7 The sample analysed is the enzymatically digested recombinant protein pharmaceutical. The resulting peptide map has been extensively characterised and can be generated accurately regarding chromatographic retention times and the measured molecular masses and relative abundances of the proteolytic peptides. Fragment ion mass spectra (MS/MS spectra) are used to identify peptides and their assignment to the amino acid sequence. Such peptide maps cover the entire sequence (or very close to it) and encompass all amino acids subject to possible modifications. Thus, from changes in relative abundance of peaks or the appearance of new peaks in the chromatogram, the protein sequence can be covered, known modifications confirmed and new ones identified (Figure 1).


Figure 1: LC-MS base peak chromatograms of three different samples (different batches) of a therapeutic protein, digested with trypsin. Each peak corresponds to single peptide (and sometimes to more than one) which can be mapped to the protein sequence from its measured molecular mass and its fragment ion mass spectrum. Changes, that is new peaks or peaks with higher or lower relative intensities, can be readily identified and modifications traced to individual amino acids. In the above figure the top two traces are essentially identical but the bottom trace shows some differences, indicated by arrows.
One such example of a critical PQA is the quantitation of acidic species in protein pharmaceuticals, as a release test and to monitor changes in stability samples. The increase or sometimes decrease of acidic species can be a result of several processes, often deamidation of asparagine residues. This can result from changes, planned or inadvertent, in the manufacturing process and can also increase from temperature and pH excursions.
Testing for acidic species is performed by ion exchange chromatography or by gel free isoelectric focusing capillary electrophoresis (cIEF).8-9 These can be complemented by a method based on the detection of β-aspartate (iso-aspartate),10 which is one of the two possible end products of asparagine deamidation, the other being α-aspartate. All these methods yield only an average of acidic species and cannot provide any indication of the nature or the location on the amino acid sequence of the protein where this modification has occurred; the latter method is not very reliable as it is subject to false negative (not all asparagine residues that undergo deamidation yield similar amounts of α-aspartate and β-aspartate) as well as false positive results (some α-aspartate may be converted to β-aspartate, which does not change the overall quantity of acidic species). As α-aspartate and β-aspartate may affect the secondary structure of the protein differently,11-12 their correct assignment to the sequence is important.
In an optimised peptide map, the peptide with the (unmodified) asparagine elutes separately from either the α-aspartate or the β-aspartate containing peptides, which also elute apart from one another. It is possible not only to identify each amino acid that has undergone deamidation but also measure how much has been converted to α-aspartate and how much to β-aspartate, thus avoiding under or overestimating the extend of deamidation, which may occur with other methods (Figure 2).


Figure 2: Extracted ion chromatograms of two asparagine-containing peptides from the same protein and the deamidation products thereof. The ratios of -aspartate and -aspartate are significantly different in the two peptides, even though the extend of overall deamidation is essentially the same in both (49% and 50%, respectively). The -aspartate detection method would fail to identify the deamidation of the latter peptide and would underestimate the extend of deamidation of the former. Mass spectrometry, however, allows for accurate quantitation of both. In the second peptide, which contains two asparagine residues, the one that was deamidated was unambiguously identified from the MS/MS spectrum.
Methods that have been used in proteomics for the identification and quantitation of proteins by database searching using MS and MS/MS peptide data can be readily applied to the identification of proteins from the cells used to produce the recombinant protein (host cell proteins – HCPs).13 HPC assessment has been typically carried out using commercial ELISA kits, which can be very sensitive, but which will fail to identify any proteins for which there are no antibodies in the HCP ELISA used.14 Searching a database with the protein sequences from the cells used for manufacture of the biotherapeutic (eg, Chinese hamster ovary (CHO) cells or yeast cells) can readily identify and quantitate any proteins from the host cells that were co-purified with the recombinant protein pharmaceutical, even though the latter is much more abundant than the former. The same approach can also be used to test for the presence of residual Protein A, which is used in the purification of therapeutic antibodies
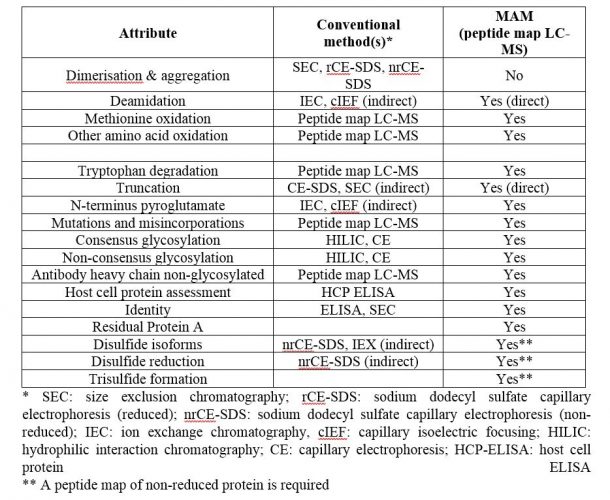
Some product release methods cannot be folded into a single Multi-Attribute Method. Cell binding and biological activity assays will continue to have their own specific methods, along with visual appearance, pH and concentration. But overall, the number of individual release tests for specific product attributes can be trimmed considerably using a properly developed MAM, as shown in Table 1.


Table 1: Critical quality attributes amenable to MAM
The three bottom attributes in Table 1, when assessed for product release (these are often characterisation tests only), would need to be measured from a peptide map generated from a non-reduced protein sample, as they involve structural features that do not persist upon reduction. The overall LC-MS MAM (chromatographic separation of peptides and mass spectrometric analysis) would remain unchanged.
Conclusion
As is apparent from the above Table 1 and the preceding discussion some of the critical quality attributes of protein pharmaceuticals are already measured by LC-MS analysis of a peptide map and the measurement of many others can be readily carried out by an LC-MS based MAM: Of course, LC-MS of peptide maps have been carried out as part of the characterisation process of protein pharmaceuticals, but hitherto not usually implemented as a release assay or when implemented it is done as a “fingerprint”, typically with only UV and no MS detection. Advances in chromatographic media, reagents, instrument performance, reliability and automation, and software make it possible to employ the full power of LC-MS to replace conventional methods used for product release testing.
Thus, an LC-MS based Multi-Attribute Method is not one more product release method but rather a science-based comprehensive replacement of several traditional methods. It streamlines the measurement of critical PQAs, optimises the use of time and resources and offers a greater level of detail, down to individual amino acids, enabling a better understanding of the properties and behaviour of protein pharmaceuticals. These benefits have been recognised by the biopharmaceutical industry and regulatory bodies and we are beginning to see the broad adoption of LC-MS-based MAM in the industry.
References
- Applications of mass spectrometry for the structural characterization of recombinant protein pharmaceuticals, Srebalus Barnes CA and Lim A, Mass Spectrometry Reviews 26, 2013, 370-388.
- Characterization of protein therapeutics by mass spectrometry: recent developments and future directions, Che G, et al. Drug Discovery Today 16(1/2), 2011, 58-64.
- Mass spectrometry for the biophysical characterization of therapeutic monoclonal antibodies, Zhang H, Cui W and Gross ML, FEBS Letters 588(2), 2015, 308-317.
- Understanding pharmaceutical quality by design, Yu LX, et al. The AAPS Journal 16(4), 2014, 771-783.
- Development of a quantitative mass spectrometry multi-attribute methods for characterization, quality control testing and disposition of biologics, Rogers RS, et al. mAbs 7(5), 2015, 881-890.
- LC-MS multi-attribute method for characterization of biologics, Xu X, Qiu H and Li N, Journal of Applied Bioanalysis 3(2), 2017, 21-25.
- A view on the importance of “Multi-Attribute Method” for measuring purity of biopharmaceuticals and improving overall control strategy, Rogers RS, et al. The AAPS Journal 20(7), 2018, 1-8.
- Chromatographic analysis of the acidic and basic species of recombinant monoclonal antibodies, Fu Y, et al. mAbs 4(5), 2012, 578.585.
- Imaged capillary isoelectric focusing for charge-variant analysis of biopharmaceuticals, Michels DA, Salas-Solano O and Felten C, BioProcess International 9(10), 2011, 48-54.
- Optimal conditions of the use of protein L-isoaspartyl methyltransferase in assessing the isoaspartate content of peptides and proteins, Johnson BA and Aswad DW, Analytical Biochemistry 192(2), 1991, 384-391.
- Degradation of growth hormone releasing factor analogs in neutral aqueous solution is related to deamidation of asparagine residues. Replacement of asparagine residues by serine stabilizes. Friedman AR, et al. International Journal of Peptide and Protein Research 37(1), 1991, 14-20.
- Analysis of isoaspartate in a recombinant monoclonal antibody and its charge isoforms, Zhang W and Czupryn MJ, J. of Pharmaceutical and Biomedical Analysis 30(5), 2003, 1479-1490.
- Applications of proteomics methods for CHO host cell protein characterization in biopharmaceutical manufacturing, Valente KN, et al. Current Opinion in Biotechnology 53, 2018,144-150.
- Host-cell protein measurement and control, Wang F, Richardson D and Shameen M, BioPharm International 28(6), 2015, 32-38.
Biography
Ioannis Papayannopoulos has been carrying out peptide and protein analytical work for the past several decades, using mass spectrometry, chromatography, spectroscopy, and other analytical techniques. Over the years Dr. Papayannopoulos has alternated between academia, most recently as director of the Proteomics Facility at the Koch Institute for Integrative Cancer Research at MIT, and the biopharmaceutical industry in senior scientific and management roles at companies such as Biogen, Covance and AstraZeneca. For the past several years he has been with Celldex Therapeutics, a biopharmaceutical company in Massachusetts, working on the analysis and characterisation of antibodies, antibody-drug conjugates and recombinant protein pharmaceuticals.
The rest of this content is restricted - login or subscribe free to access
Thank you for visiting our website. To access this content in full you'll need to login. It's completely free to subscribe, and in less than a minute you can continue reading. If you've already subscribed, great - just login.
Why subscribe? Join our growing community of thousands of industry professionals and gain access to:
- bi-monthly issues in print and/or digital format
- case studies, whitepapers, webinars and industry-leading content
- breaking news and features
- our extensive online archive of thousands of articles and years of past issues
- ...And it's all free!
Click here to Subscribe today Login here


Please note a couple of typographical errors, which may cause some confusion:
Second sentence in the paragraph below the Figure 2 legend:
“but which will fail to identify any proteins for which there are no antibodies in the HCP ELISA is used.” should read instead “but which will fail to identify any proteins for which there are no antibodies in the HCP ELISA used.”
First sentence immediately below Table 1:
“The three attributes in Table 1, when assessed for product release” should read “The three bottom attributes in Table 1, when assessed for product release”.
Many thanks for the points of clarification, Mr Papayannopoulos; we’ve made your suggested amends. Kind regards