Two-dimensional liquid chromatography (2D-LC) with multiple heart-cutting
Posted: 23 May 2018 | Lars Decker Nielsen, Naja Wessel Jacobsen | No comments yet
Two-dimensional liquid chromatography (2D-LC) has obtained increasing focus over the past two decades. At LEO Pharma, we continuously evaluate new laboratory techniques with the potential to advance our drug discovery and development. We installed a MHC 2D-LC 18 months ago and have found it valuable in a broad range of applications. This article covers how we use the system in our analytical troubleshooting laboratory and how it can be applied to solve key tasks in the lab.


TWO-DIMENSIONAL liquid chromatography (2D-LC) offers additional selectivity compared to conventional HPLC and is therefore of particular interest for complex samples. In practice, a 2D-LC system consists of two HPLCs, the first dimension (1D) and the second dimension (2D). The two dimensions are connected by a valve and loop system.
There are two different types of 2D-LC: comprehensive and heart-cutting. In comprehensive 2D-LC, the entire 1D is cut into small sections and analysed in the 2D within the run-time of the 1D method. This setup gives additional selectivity over the entire 1D chromatogram, but the 2D run time is limited to the sampling time in the 1D. To avoid loss of separation already obtained in the 1D, fast sampling times are required and very fast ‘D methods are implicitly required.1
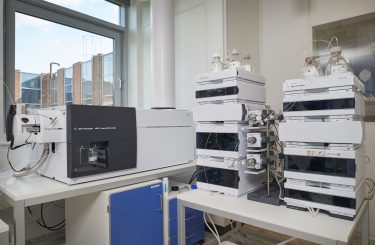
In heart-cutting 2D-LC, selected sections from the 1D are cut and analysed in the 2D. In this setup the runtime of the 2D is independent of the sampling time in 1D, allowing for much extra chromatographic resolution for the selected sections (heart-cuts) of the 1D. A further development to the heart-cutting 2D-LC system is multiple heart-cutting (MHC) 2D-LC. which allows for heart-cutting of multiple sections from the 1D. Each cut is stored in a loop system until the 2D is available for analysis.2 A picture of our 2D-LC with MHC is shown in Figure1.
MHC 2D-LC


Figure 1: Our MHC 2D-LC system. Two HPLC systems are connected by a valve system. The valve system allows for cutting and storage of up to 12 cuts at the time, all cuts are analysed in the 2D as this become available.
The increased resolution of MHC 20-LC has been used to separate specific analytes from sample matrix or other compounds to characterise those further and to enable quantification of low-level impurities by 2D-LC-UV2 or 2D-LC coupled to mass spectrometry.3,4,5 The resolution has also been used to investigate main peak purity in order to evaluate the specificity of a method.6 The combination of an achiral 1D method with a ultrafast chiral reverse phase (RP) method in the 2D has also been described for MHC 2D-LC.7
When analysing biopharmaceuticals, chromatographic systems requiring MS incompatible buffers or very high salt concentrations are often needed. The 2D of a MHC 2D-LC has been used in these cases as an easy method to remove the analytes from the highly water-soluble buffer and salts needed for the 1D separation, and thereby obtaining MS compatible methods for biopharmaceuticals.8,9,10
Recently, a paper was published addressing the issue of validating MHC 2D-LC methods for future use in a GMP laboratory environment. The authors conclude that areas other than hardware capabilities and validation needs must be considered. For instance, more user-friendly software is required before MHC 2D-LC is likely to become a routine application suited for regulated environments.11
Characterisation of impurities
One of the recurring tasks in our laboratory at LEO Pharma is identification of unknown impurities. We are most often presented with a sample and a HPLC-UV chromatogram, in which a small unidentified peak is observed and we need to increase our knowledge about the peak. Our first step is almost always to run an LC-MS experiment using the same or similar chromatographic setup suitable for MS detection, which was used when the peak was first observed. In many cases this works like a charm and we can generate a formula for the impurity and sometimes structural information based on fragmentation pattern.
However, in other cases MS detection is not directly possible or does not result in useful data. In these cases 2D-LC coupled to MS can be a fast and elegant way forward.
Impurities in the presence of severe interference
A new impurity of 0.1 % was observed in a topical drug product, eluting on the tail of the peak from the active pharmaceutical ingredient (API). The impurity was barely separated from the API peak in the UV chromatogram, and the UV spectrum from the impurity was different from the API. It was not possible to significantly improve the 1D separation between the impurity and the API.
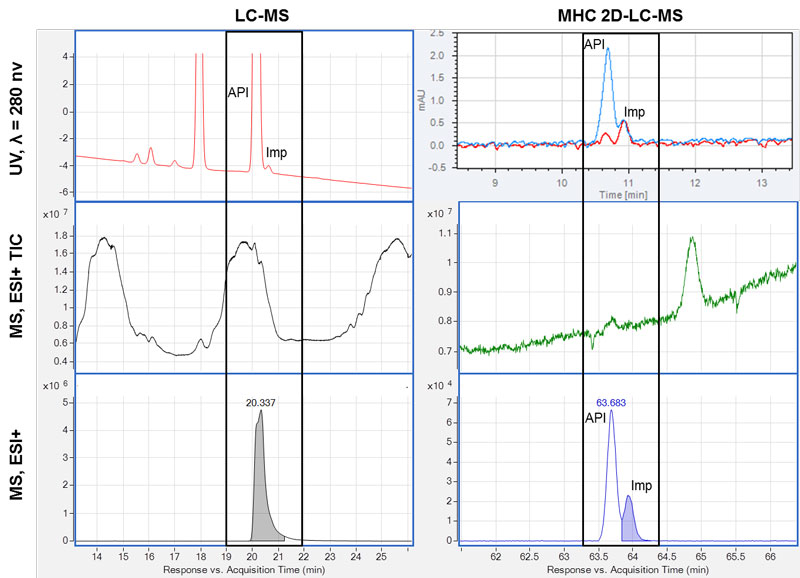
When MS detection was added, significant tailing of the API MS signal was observed due to saturation of the MS. In addition, massive signals from the excipients in the drug product were observed over a large part of the chromatogram. Chromatograms illustrating this troublesome case are presented in Figure 2.


Figure 2: Removal of interference by 2D-LC. Six chromatograms of a sample analysed by LC-MS (left) and by MHC 2D-LC-MS (right) are shown. The time segments where the impurity (API) and the active pharmaceutical ingredient (API) elute are marked with a black box. A: top, UV chromatograms at 280nm; middle, MS total ion chromatograms (TIC), dominated by eluting excipients; bottom, MS compound chromatogram – only the API is found. B: UV chromatogram overlay of two cuts across the impurity; middle, MS total ion chromatograms (TIC) with no/minimal signal from excipients; bottom, MS compound chromatogram with two compounds observed corresponding to the API and the impurity.
We were not able to identify any compound at the relevant retention time of the impurity using the MS software algorithms, and inspection of the mass spectra extracted at the relevant retention time was dominated by the pharmaceutical excipient and the API itself.
An MHC 2D-LC-MS experiment was chosen to avoid saturation of the MS caused by the API and the excipients by heart-cutting of the impurity for additional 2D chromatographic separation to obtain a cleaner mass spectrum.
The UV chromatograms from the 2D showed the presence of both the API and the impurity in two cuts. The peaks were adequately separated and the elution order of the compounds was confirmed by their UV spectra. The use of the additional dimension gave a large reduction in the interference from excipients and API with the impurity. A compound search was performed at the retention time of the API and the impurity. Two isomeric compounds, ie, with the same mass and isotopic pattern, were found – one corresponding to the API and the other compound was the impurity. This could not have been established with LC-MS alone.
Impurities in the presence of non-volatile components


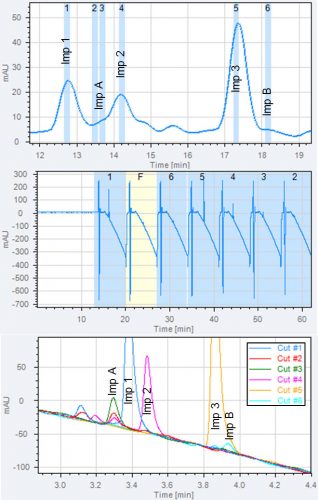
Figure 3: Removal of non-volatile buffer to enable MS analysis. Three chromatograms from a 2D-LC experiment are shown.
A: 1D chromatogram, heart-cuts of three known impurities are taken (imp 1, 2 and 3) and heart-cuts of the two unknown impurities Imp A and B. The positions of the heart-cuts are shown with blue boxes.
B: 2D chromatogram overlay of all heart-cuts. All analytes are retained in the second dimension.
C: total 2D chromatogram showing the serial analysis of all heart-cuts. The chromatogram is used to program the timing of MS divert valve. The first two minutes of each 2D chromatogram is sent to waste to avoid buffer in the MS.
In this case, two unidentified impurities (imp A and B) were observed in a drug product analysis, with levels just below the acceptable limits. The method for analysis of the drug product included a phosphate buffer. The method was very sensitive to mobile phase modifications and had several other impurities eluting close by imp A and B.
Phosphate buffer or other non-volatile components in the mobile phase makes an HPLC method incompatible with MS due to ion suppression and deposits of non-volatile components on the spray shield. In this case, exchange of the buffer caused shifts in the separation of the impurities and we could no longer be certain of the position of imp A and B.
We therefore went straight to a 2D-LC-MS setup using the following stepwise approach (chromatograms are shown in Figure 3):
- Recreate the chromatogram using the same chromatographic conditions as the laboratory that originally encountered the problem.
- Set up the 2D method ensuring MS compatibility as well as retention of imp A and B and other closely eluting peaks from 1D. All compounds should preferably be separated from each other in 2D for indisputable MS characterisation.
- Attach the 2D outlet to the MS and program the MS to send the first few minutes of each 2D chromatogram to waste to avoid phosphate buffer in the MS.
By using this setup we were able to obtain high-quality MS spectra. From the recorded accurate mass data and isotopic pattern, the formulas of the unknown impurities were identified. They were both isomers of known impurities eluting in the same part of the chromatogram.
Tracking unidentified peaks across methods
During drug development and the lifecycle of a product, chromatographic methods are improved and in some cases entirely new methods are developed. In these cases, there is a need to ensure and demonstrate the specificity of the new methods.
When a new method is developed, we need to establish the retention time of the relevant impurities. However, there may be several obstacles: standards of impurities not available in pure form; MS is of limited value due to many isomeric impurities or MS incompatible buffers; UV spectra of limited use due to similarity between compounds.
The 2D-LC setup at LEO Pharma
Equipment: We use an Agilent 1290 Infinity 2D-LC system with multiple heart-cutting. The system has two column ovens and two photodiode array (PDA) detectors. When MS is required we add an Agilent 6550 QTOF to the outlet of the 2D PDA.
1D LC setup: The first dimension (1D) setup is maintained as close to the setup used when the problem/impurity was originally observed. We often downsize the column to one with 2mm ID and adjust the flow accordingly.
Heart-cutting: We have twelve 40µL loops in the valve systems, allowing multiple cuts across the 1D. We use time-based or peak-based cutting as appropriate.
2D-LC setup: The second dimension (2D) column, temperature, and mobile phases are selected based on the problem at hand (eg, best possible resolution, ‘most orthogonal’, or removal of buffer). To balance the effects of a large injection volume (40µL) and being able to use MS without splitting the flow, we use columns with 3mm ID and a flow of 500µL/min in 2D.
In order to determine how the peaks correspond to each other in the two methods, we use a 2D-LC experiment: In 1D we set up the old method and in 2D we set up the new method. Using multiple heart-cutting, each peak of interest from 1D is sampled and analysed in 2D. This way we establish the retention time of each peak of interest in the new method without the need for standard material or MS detection, even for minor impurities.
Options for evaluating main peak purity
During method development and validation there is a question that keeps popping up: are we sure that the main peak is pure? This is of course a relevant question, as we are in the business of ensuring the quality of our drug products and ultimately the safety for our customers. We need to demonstrate the API peak does not conceal any unknown impurities from either degradation or synthesis. What options do we have for this task?
- UV peak purity: This is not very sensitive or specific for related impurities
- LC-MS: Evaluation of the MS signal for co-eluting impurities is not easy, due to saturation of signal and in-source fragmentation
- Orthogonal chromatography: Data interpretation is tedious and peak tracking is not easy, as all present impurities must be accounted for
- NMR: Sensitivity is not adequate and data interpretation is difficult
How about 2D-LC? This application was originally one of the key drivers for us to enter the 2D-LC arena. The greatest advantage was that we could maintain the original separation of impurities and the main peak and just focus on any impurities detected below the main peak by the second dimension.
Generic screening system for evaluating main peak purity by 2D-LC


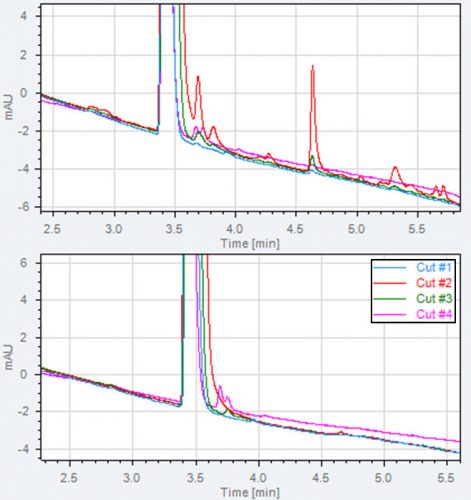
Figure 4: Example of main peak purity evaluation and impurities formed in the 1D UV detector. Two 2D chromatogram overlays of four heart-cuts taken across
a main peak are shown in the figure. A: the 1D UV lamp is on and impurities are observed in all four heart-cuts.
B: the 1D UV off, in heart-cut 1 and 2 no impurities are observed, in cut 3 and 4 small impurities are observed.
We use four methods in the second dimension; these are chosen to have different selectivity within the reversed phase separation space. We have learned it is important that the 1D and 2D columns have comparable hydrophobicity to ensure acceptable peak shape. The starting point of the 2D gradient is to some extent decided by the 1D method.
Assuming the method we need to evaluate is a C18-based acetonitrile gradient, which is often the case, we use the following kit of columns and organic modifiers as a starting point:
- Embedded polar group (Zorbax Bonus RP) using acetonitrile and/or methanol
- Pentafluorophenyl (ACE Excel C18-PFP) using methanol
- Phenyl (ACE Excel C18-AR) using methanol
- Cyano (ACE CN-ES) acetonitrile and/or methanol
Each sample is analysed using each of the methods above in the 2D. Three or more heart-cuts are taken across the main peak to ensure the entire peak is sampled. Any peaks observed in the second dimension are compared to the relevant threshold applicable to the API or drug product. Examination of main peak purity works out for some API, but has been more challenging for others due to the occurrence of ‘artefacts’.
‘Artefacts’
We have experienced ‘artefacts’ formed during the three seconds passage of the 1D UV detector. These artefacts are seen in the 2D chromatograms and can be recognised as peaks eluting in multiple heart-cuts taken across the entire main peak.
This phenomenon is presented in Figure 4A. The main peak purity without UV detection in 1D can be used for light sensitive compounds. Figure 4B shows the presence of two genuine impurities coeluting with the main peak in the
1D method. A detection limit below 0.05% was obtained here.
We have experienced degradation in 1D UV for several API giving rise to artefacts in the 2D in the range 0.1% to 1.5% area percentage. When we do 2D-LC main peak evaluations, we keep in mind that genuine impurity peaks must be present: when the 1D UV lamp is switched off; when the heart-cut is analysed instantly, since in-loop degradation is also possible.
About the authors


References
To view references, please visit: www.europeanpharmaceuticalreview.com/3-17-Jacobsen


