Applying PAT in pharmaceutical processes
Posted: 1 November 2010 |
As cited by the FDA, “Process Analytical Technology (PAT) is a system for designing, analysing, and controlling manufacturing through timely measurements (i.e., during processing) of critical quality and performance attributes of raw and in-process materials and processes with the goal of ensuring final product quality.”1 The main goal of PAT is to gain a deep understanding of manufacturing processes and to learn how to control them1. When processes are understood, opportunities for continuous improvement (quality and efficiency), cycle time reduction, cost reduction and QC lab test replacement arise. In this article, the strategy of Johnson & Johnson Pharmaceutical Research & Development (J&J PRD) towards the implementation of PAT in Pharmaceutical Process Development is explained and elucidated by case studies.
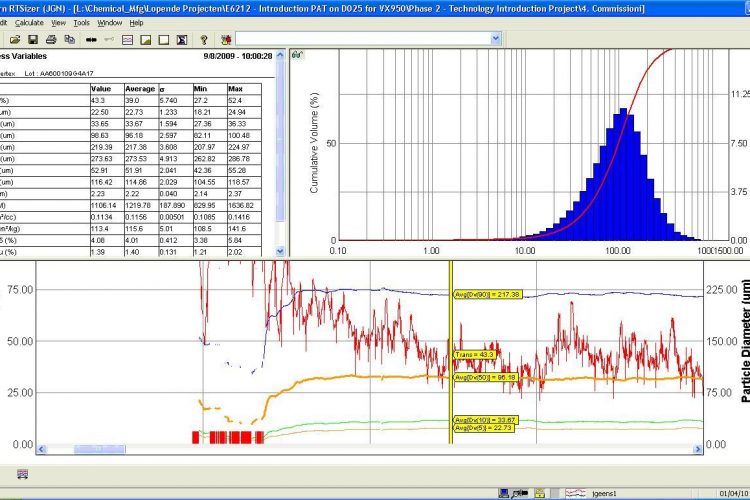
Figure 2 Spray drying. Screenshot of on-line PSD analysis, providing real-time PSD-measurement (top-right) and continuous PSD-monitoring (bottom; d50-orange, d90-blue, d10-green, transmission-red)
As cited by the FDA, “Process Analytical Technology (PAT) is a system for designing, analysing, and controlling manufacturing through timely measurements (i.e., during processing) of critical quality and performance attributes of raw and in-process materials and processes with the goal of ensuring final product quality.”1 The main goal of PAT is to gain a deep understanding of manufacturing processes and to learn how to control them1. When processes are understood, opportunities for continuous improvement (quality and efficiency), cycle time reduction, cost reduction and QC lab test replacement arise. In this article, the strategy of Johnson & Johnson Pharmaceutical Research & Development (J&J PRD) towards the implementation of PAT in Pharmaceutical Process Development is explained and elucidated by case studies.
Process understanding and control starts with making the process visible. To achieve this, analysers which are capable of measuring critical chemical and physical characteristics with a fast response time are required. While these analysers can be used for on-line (bypass on the process) or at-line/off-line (near the process / in the lab) measurements, in-line (in the process) measurements are preferred as they provide a continuous live feedback of the entire process. In addition, they eliminate manual sample handling and therefore reduce operator errors, improving safety and retaining sample integrity. We at J&J PRD have developed a four stage approach to implement PAT for chemical and pharmaceutical processes.
In the first stage, a process analyser is employed and in-process samples are taken, which are analysed in the lab with traditional analytical methods, like chromatography, Karl Fisher titration, etc. During this stage, process knowledge is increased, allowing optimisation of the process and even definition of the design space. For new products, this is a standard approach which is often combined with the design of experiments so as to identify the critical to quality attributes (CQA’s). For existing products, PAT is often applied as either a problem-solving tool (e.g. extrusion example) or when the cost of the old process is too high (e.g. cleaning processes). In this stage, the signal of the PAT tool is challenged by the lab analysis of the in-process samples.
In the second stage, the optimised process is continuously monitored with the PAT tool, while the product or equipment is released by the lab analysis of the final sample with an official validated analytical method. During this stage, the performance of the PAT tool and the robustness of the optimised process are evaluated. A decision is made whether or not to apply PAT for further batches (e.g. up-scaling, commercial batches, etc.) and to transfer it from R&D to manufacturing. Although manufacturing often demands a robust optimised process without PAT, their position is slowly changing as they start to recognise the benefits of PAT as a control tool or monitoring tool. Considering the amount of batches in R&D and manufacturing, it has a large added value to apply PAT within manufacturing.
In the third stage, decisions with regard to the product are made based on the signal of the PAT tool. Therefore, the PAT tool indicates the right quality of the product and allows firstly, the determining completion of the process – instead of using a fixed time period – and secondly, a real-time release. In this stage, it can be considered that the QC lab is brought to the process.
The fourth stage includes the ultimate goal of PAT, real-time control of the processes. This implies that processes are steered by the PAT signal, and that each batch is delivered with the right quality product in the most efficient way. In order to achieve this, the effect of each process parameter needs to be known. In this stage, process validation evolves to the validation of the process parameters, which control the entire process.
Granulation
In the pharmaceutical industry, granulation is often employed to develop high quality solid dosage forms (tablets) when direct compression is not applicable. Both wet and dry granulation techniques can significantly improve the physical properties of formulations as a means to deliver robust processes to manufacture tablets. A variety of techniques can be utilised to build granules including but not limited to; fluid bed, high shear, roller compaction and so on2. For each of these operations, particle size and distribution (PSD) is a CQA targeted to monitor and control.
Based on the implementation strategy previously described, we have taken advantage of mid to late development to build several workflows around fluid bed granulation, utilising in-line focused beam reflectance PSD analysis and NIR for moisture content measurements. Specialised probes are required to avoid fouling of the probe3. Collection of this in-line data has allowed us to build a number of models describing the relationships that exist between PSD, moisture and critical process parameters (CPP’s) of CQA’s. The in-line PSD data was shown to be sensitive and characteristic to the processing conditions and formulation. Operating with both these tools, we have developed processes where decisions can be made using the in-line data with downstream models (second stage). As an example of a simple model, we have described a (PCA) model relating PSD (c10, c50, c90)4 at end of dry in fluid bed to dissolution quality (percent dissolved) and hardness (Figure 1). The experiments used to build this model consisted of 10 batches with varying process conditions as part of a traditional DOE. You can clearly see the inverse relationship of particle size to hardness and the positive influence of particle size to per cent API dissolved.

Figure 1 Granulation. PCA scores plot demonstrating the relation of PSD (c10, c50, c90) towards dissolution quality and hardness
Currently we are extending these relationships to build models to incorporate the fourth stage of our phased approach to PAT development. We have found this characterisation to be essential to develop and transfer a process in the most robust and time efficient manner. In today’s lean, just in time development environment, we have found that the use of tools that are sensitive to monitor CQA’s can significantly cut down on development work by efficiently characterising and understanding your process regardless of the site, equipment or scale.
Spray drying
Spray drying is a technique that can be used to produce amorphous drug products leading to significantly increased bio-availability. For a specific product, the PSD of the spray dried dispersion is critical to ensure good compressibility of the powder blend. The PSD can be correlated to the spray drying process parameters (CPP’s). As the acceptable PSD-range is narrow, justification of a monitoring and control tool for real-time particle size was investigated.
We choose to utilise an in-line PSD-analyser which enabled the continuous measurement of the spray dried dispersion. This has led to multiple observed benefits, illustrated in Figure 2. The primary goal was to monitor the product quality continuously during the spray drying process, and adjust the process parameters if required. The PAT application provided a robust and reproducible measurement, which can be used as input value(s) for a feedback control loop. In this way, the risk for out-of-spec batches can be significantly reduced. For future development, the opportunity for real-time release can be considered, resulting in reduced QC-effort.

Figure 2 Spray drying. Screenshot of on-line PSD analysis, providing real-time PSD-measurement (top-right) and continuous PSD-monitoring (bottom; d50-orange, d90-blue, d10-green, transmission-red)
A second important benefit was the clear monitoring of the start-up fraction of the spray dried dispersion. This start-up fraction is discharged as waste and is currently defined with a validated start-up time. Utilising a real-time PSD-measurement, the time required for start-up could be determined precisely. It was observed that a 50 per cent reduction of start-up time was feasible, resulting in increased yield and less waste.
Although the project was clearly driven by this specific product, the most important benefit was probably generated in increased process and equipment understanding in general. The lessons learned were highly valuable for development activities of other new products. The use of this PAT application should lead to increased process knowledge, process robustness and contribute to improved scale-up and tech-transfer. This example is fully in-line with the general strategy described above, leading in the longer term to reduced costs for introduction of new products.
Extrusion
To prevent drug abuse of a medicine for chronic pain, an extrusion process has been applied to obtain the required characteristics for a tampered resistance formulation. Utilising an extrusion process converted the blended powder into a very long solid rod; this rod is then cut and pressed into tablets. Each batch has a 24 hour extrusion process producing approximately 250,000 to 750,000 tablets. Occasionally, tablets with a marble spot are visually detected. These spots are easily visible and have a higher density and off-white colour. Investigations showed that the API concentration in the spot is higher. Therefore, there’s a risk for producing high-potency tablets. As the occurrence is random and seldom, a PAT application was initiated to monitor the extruded rod as to detect and remove the defected sections from the production line in real-time. As a requirement for the PAT application, spots with a minimal diameter of one millimetre should be detected. Furthermore, a 100 per cent control must be achieved, implying the analysis of the entire volume and not only the surface of the rod. The analysis should be really fast, as the line speed of the extrusion and cutting process is maximal 10 centimetres per second. On top, it was preferred for the analysis to be easy to interpret and that the process analyser requires no maintenance. Evaluation of several PAT analysers showed that thermal and acoustic imaging was incapable of detecting the marble spot. NIR spectroscopy had the capability to detect the marble spots, but when applied in transmission mode the analysis could not keep up with the pace of the process. In addition, NIR reflection spectroscopy is only capable of analysing the surface, and therefore not sensitive to the detection of marble spots inside the rod. NIR analysis showed that the tablets and rods are fairly transparent for radiation, which triggered the application of visual light transmission. In the laboratory, this was investigated by illuminating the rod with a flashlight and collecting the transmitted radiation via a fibre optic to a CCD detector. Each time the marble spot was directed into the flashlight, the number of detected photons decreased. Utilising the experience of an external partner, it was demonstrated in a laboratory environment that a CCD camera is capable of producing images, with clear contrast between a normal rod and marble spots (Figure 3). Detection of the spots was found to be dependent on the position of the marble spot with respect to the detector. It was observed that the contrast of the images was less pronounced when the marble spot was located towards the light source (i.e. opposite side of the detector), and the detection size reduced when the marble spot was located perpendicular to the detector. Thus, the detection is susceptible to interpretation and further discussion. Therefore, it was decided that in a production environment, three systems will be set-up in serial, with each system rotated 120° relative to each other. This set-up allowed us to view the entire extruded rod with 100 per cent control. It was determined that the marble spots are due to build up of API in a dead volume at the screw tips and that they are never observed during the first 12 hours of production. The current control strategy is based on an inter mittent cleaning step into the batch process. Therefore, the need for a 100 per cent control tool on the commercial production line has diminished, which has impacted the implementation of the PAT application.

Figure 3 Extrusion. Visual images, captured by a CCD camera, of a normal rod (a) and a rod with a marble spot, located parallel (b) and perpendicular (c) to the detector
Blending
We have utilised NIR reflection spectroscopy in the blending process to determine blend uniformity. The lid of the bin is equipped with a sapphire window on which the NIR spectro – meter is mounted. With each rotation of the bin, the blend makes contact with the window and a NIR spectrum is collected. Blend uniformity is reached at the moment that the spectra do not change anymore (or slightly) with each rotation, allowing endpoint detection. As blending processes are limited in time, reduction of the blend time by in-line endpoint detection has no significant business benefit. Therefore, the blend time is kept fixed and the process is characterised by the in-line NIR analysis, which can show the stability of the blend process. During product development, in-line NIR analyses reduce the number of laboratory analyses, allowing a faster development time. As a next step, the NIR trend analyses are linked to the final product characteristics like content uniformity. Therefore, in-line monitoring of the blend process can be a predictive characteristic for the quality of the final product.
Cleaning
Most of the equipment in pharmaceutical units used to develop and produce pharmaceutical products is multipurpose equipment. Because cross-contamination is potentially harmful for the patient, cleaning processes are essential and critical. Pharmaceutical cleaning processes consist of a number of manual and/or automated steps mainly involving the use of water and detergents. Generally, a water step is used as the final rinse step, enabling an in-line or on-line release of the equipment using non-specific techniques like e.g. TOC, conductivity and/or pH if possible. A disadvantage of these analytical tools is that they are usually not capable of building process knowledge of the previous detergent steps due to over saturation (e.g. TOC content) or highly fluctuating signals (e.g. conductivity) masking the product signal. By applying UV/Vis spectroscopy in-line or on-line, we are able to monitor each step within the cleaning process and have the possibility to also perform immediate release of the equipment at the end of the cleaning5-6. A major difficulty encountered in pharmaceutical cleanings is the turbidity of some of the detergents used; this is caused by the surfactants they contain. We have found this to be especially true at higher temperatures. We have been able to address this issue by placing a cooling element just before the measurement cell, reducing the turbidity and making the process signal representative. In this way, we discovered that a large amount of the pharmaceutical cleaning processes are serious overkill and can be optimised achieving a better quality and reducing cycle time, cost and waste.
Conclusion
The visualisation of pharmaceutical processes by PAT tools and the inherent increased process knowledge (i.e. stage 1 of the company’s strategy) has resulted in rapid and significant benefits. In all cases, PAT enabled us to build more robust and efficient processes, thereby increasing product quality and reducing cost, time and waste. Already, the first steps are being taken for real-time control of pharmaceutical processes (e.g. granulation case), the ultimate goal of PAT still requires a significant effort to finalise (related to qualification, automation etc.). For many applications, obtaining process knowledge by implementing stage 1 and 2 has led to business cases / control strategies which often seem to inhibit implementation of the PAT tool for release or control of the operation. Understanding the process knowledge gained in stage 1 and 2 has been shown to strongly support commercial strategies.
Acknowledgement
Implementing PAT requires the expertise of many people. Therefore, we want to thank all the people within J&J who contributed to the successful introduction of PAT in the company.
References
1. U.S. FDA (2004) “Guidance for Industry: PAT – A Framework for Innovative Pharmaceutical Development, Manufacturing, and Quality Assurance”
2. Dilip M. Parikh (2010) “Handbook of Pharmaceutical Granulation Technology, Third Edition”, NY, Informa Healthcare USA Inc.
3. Huang J., Kaul G., Utz J., Hernandez P., Wong V., Bradley D., Nagi A. and O’Grady D., (2010) “A PAT approach to improve process understanding of high shear wet granulation through in-line particle measurement using FBRM C35”, J Pharm Sci. Jul, 99 (7), 3205-3212
4. Barrett P. and Glennon B., (1999) “In-line FBRM Monitoring of Particle Size in Dilute Agitated Suspensions.” Particle & Particle Systems Characterization, 16, 207–211
5. Hellings M. and Vanbaelen H., (2008) “The Application of PAT for Cleaning and Cleaning Validation”, American Pharmaceutical Review Issue July/August
6. Hellings M., Van den Kerkhof T. and De Smet K., (2009) “Applying PAT in Chemical Process Development”, European Pharmaceutical Review Issue 3
About the Authors
Mario Hellings
Mario Hellings received his PhD in Science in 2004 and subsequently started working for Johnson & Johnson in the department of Analytical Development. Currently, Mario is working as a senior scientist in Analytical Sciences and COES, where he leads the analytical group responsible for the implementation of PAT within Johnson & Johnson.
Tom Van den Kerkhof
After obtaining his PhD at the University of Antwerp in 2002, he started working for Johnson & Johnson Pharmaceutical Research and Development in the Analytical Development department. After introducing NIR spectroscopy in the lab for the release of clinical trial samples, he soon became responsible for implementing process analytical tools, specialising in optical spectroscopy.
Jeroen Geens
Jeroen Geens obtained his PhD in Chemical Engineering at K.U.Leuven in 2006. He joined Johnson & Johnson in 2005, as a technologist in Chemical Production, supporting the intro duction of new technology platforms, as well as spray drying activities. Currently, he is working as a senior engineer Solids & Oral Liquids in the DP Pilot Plant, in support of DP development and tech-transfer teams.
Steve Mehrman
Steve Mehrman is currently a Principal Scientist at JJPRD based in Spring House, PA. He received his BSc in Chemistry from Minnesota State University and a PhD in Organic Chemistry from the University of Nebraska. Steve’s research interests are focused on scale-up with real time process modelling and monitoring.