Mass Spectrometry: another tool from the PAT toolbox
Posted: 11 November 2005 | | No comments yet
Optical techniques can not address every application need, so the well-equipped PAT toolbox must include a broad array of technologies. One analytical tool that has been less-published but no less useful than the optical methods is mass spectrometry. This article provides a brief review of some of the published uses of process mass spectrometry, and provides some specific examples from the authors’ labs that demonstrate the value and utility of this technique.
Mass spectrometers have been commercially available since the 1940s, and have been used in process applications since that time1,2. In the Manhattan Project, Ernest Lawrence actually used the mass spectrometer as a production tool, rather than a control element, in the purification of weapons grade uranium3. In each of these applications, as well as others of the period, it was noted that interfacing to the process (i.e. sampling) was one of the most critical elements of an installation. Following the appearance of inexpensive microprocessors, the field experienced another boost, as noted in a review by Scrivens and Ramage4. This article provided a snapshot of current process mass spectrometry developments circa 1984, and it touched again on sampling issues, in addition to addressing developments arising from advances in microprocessor control. “Purpose-built instruments”, rather than modified laboratory equipment, were for the first time available commercially, and the authors credit this availability as having significantly broadened the impact of the technique. A decade later, Walsh and LaPack provided a tutorial on process mass spectrometry5 that mentioned Dow Chemical Company’s then 20 years of experience with process mass spectrometers, and alluded to the proliferation of installations within Dow concurrent to the advent of benchtop instrumentation and inexpensive computers. This article also described in some detail a number of different inlet systems for various processes, including simple capillaries, crimped tubes, membranes, and other techniques.
More recently, the semi-annual Application Reviews version of Analytical Chemistry provided a series of detailed articles on process analysis, with an extensive section on mass spectrometry applications6,7,8,9. In this latter series of reviews the broad applicability of the technique is demonstrated by applications ranging from environmental and medical analysis to the monitoring and control of biofermentations and steel production.
As noted in several of the cited review articles, two challenges have historically limited the use of mass spectrometry in both traditional and process applications. The first is the necessity of vacuum to provide the required mean free path for the unhindered transport of ions from the source to the analyser. Historically, this has meant that large, expensive, and maintenance-intensive vacuum pumping systems were required. Recently, there has been significant progress in vacuum technology to minimise this challenge. However, the vacuum hardware still constitutes a major issue, as noted in a review article by Badman and Cooks10. The authors present a number of clever approaches to miniaturization of several different types of mass analysers, and point out the absence of compatibly sized pumping systems. The authors conclude that with the advent of appropriate vacuum technology, “It is not too much of an extrapolation to be able to look forward to a time when mass spectrometers will be ubiquitous sensors, and perhaps even consumer devices.”
The second challenge is related to addressing applications involving condensed phase materials (solids and liquids). For vapor samples, material can be easily introduced into a mass spectrometer as long as an appropriate pressure drop is maintained into the analyzer and condensation can be avoided. In contrast, the efficient volatilisation, ionisation, and detection of condensed phase analytes can be quite challenging. Fairly recently, practical solutions to addressing these issues have been realised, and the importance of these accomplishments were recognized with Nobel prizes for electrospray ionizationionisation (ESI) and Matrix-assisted Laser Desorption Ionisation (MALDI), for liquids and solids respectively, in 200211.
Once these ionisation technologies became available, it was only a matter of time before creative analysts began deploying them for real-time analysis. Interfacing mass spectrometers to “real-world” reaction mixtures using ESI and the related process of atmospheric chemical ionisation mass spectrometry (APCI) was demonstrated using flow injection analysis in a flowing stream of solvent to monitor reaction completion in real time12. A series of articles13,14,15 described the use of a dynamic dilution system to directly interface a series of heterogeneous reaction mixtures (up to 26 wt % in reactants) into an unmodified commercial ESI source, in a method referred to as On-line Electrospray Mass Spectrometry (OLEMS).
More recently, independent studies by Cook, et al.16,17 and Cody and Laramee18,19, have led to the introduction of additional ionizationionisation techniques that can be readily applied to condensed phase samples at ambient pressure. The method developed by Cooks et al. involves electrospraying charged solvent droplets onto a surface, with or without the inclusion of reagents in the solvent, in a hybrid of electrospray and desorption ionisation with the apt moniker of Desorption Electrospray Ionisation (DESI). The method developed by Cody and Laramee, known as Direct Analysis in Real Time (DART), relies on charge exchange at atmospheric pressure and ground potential between the analyte and excited-state atoms produced in the source. Both authors speak to the applicability of their techniques to real-time, high throughput applications, frequently the purview of process mass spectrometry.
Since there is active research directed at reducing analyser size, cost, and complexity, as well as creative new approaches to introducing and sensitively analysing compounds out of increasingly complex matrices, it seems inevitable that these developments will impact the landscape of process mass spectrometry over the next several years. While these advances will continue to expand the potential application base, it is possible to do many useful and insightful experiments that take advantage of readily available, inexpensive and robust mass spectrometer technology.
That being said, it should be noted that with currently available commercial equipment, mass spectrometry is still generally better suited to chemical process development applications, where flexibility and the high information content can be more easily justified against the cost and complexity of the technique. For most vapour phase applications, there is fundamentally no technical difference between lab or pilot scale experiments, allowing a facile transition of the technology across scales during process development. Commercial process mass spectrometers are available with all the requisite capabilities to perform self-diagnostics and to communicate with plant control equipment, allowing validatable operation for GMP installations.
On each of the applications that follow, electron ionisation (EI) was used, and the analysis was performed in a quadrupole mass spectrometer. All of these analyses were performed on real pharmaceutical processes, either in development equipment or on commercial processes.
Applications for process mass spectrometry
Dryer monitoring
One of the most obvious applications for process mass spectrometry is for the real-time control of drying operations, particularly in the monitoring of trace organic solvents used in the production of active pharmaceutical ingredients (API) and intermediates. Drying (and obtaining laboratory assay for forward processing) is frequently the rate-limiting step in API manufacture, and it is also generally one of the final steps in bulk manufacturing. Consequently, there can also be significant implications on product quality as the material is forward processed for drug product formulation. Drying parameters have been shown to affect the polymorphic form of the dried material20. A number of researchers in the pharmaceutical arena have used techniques such as mid-IR21, and NIR22,23 to monitor drying processes, in order to both decrease the cycle time in the equipment, as well as eliminate exposure to both process and operators when extracting samples from the equipment.
While the optical methods can provide valuable dryer data, mass spectrometry offers several attractive features for this application as well. First, many dryers are operated at sub-ambient pressure to expedite the drying process, so interfacing a mass spectrometer to the manufacturing equipment is relatively straightforward, since most commercial instruments operate at high vacuum (10e-5 to 10e-7 torr). In addition, the mass spectrometer can be used to gauge the integrity of vacuum processing equipment, by simply monitoring the background signal for oxygen on equipment operated under a nitrogen purge, or by performing regular leak checks, particularly after a periodic maintenance (PM) cycle. A second advantage of a mass spectrometry system is that it effectively performs a bulk measurement that assays the whole dryer, rather than extracting a thief sample or relying on the placement of an optical probe. Consequently, analysis by MS helps mitigate concerns regarding sample homogeneity that can pose problems for alternative methods24. Finally, as with any on-line technique, real-time data from a mass spectrometer can be collected to assess variability in upstream processing (e.g. centrifuge drops, cake washing, hold times) that may ultimately have significant affect on product yield and quality.
The historical citation from the 1950s noted earlier2 referred to control of a dryer, and the use of a mass spectrometer for dryer control has been cited in the commodity chemicals industry25. Not surprisingly, publications describing the monitoring26 and control27 of dryers are among the few publications describing the use of process mass spectrometry in the pharmaceutical industry.
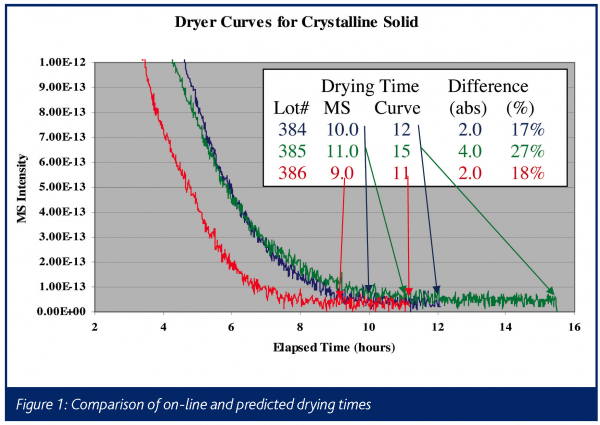
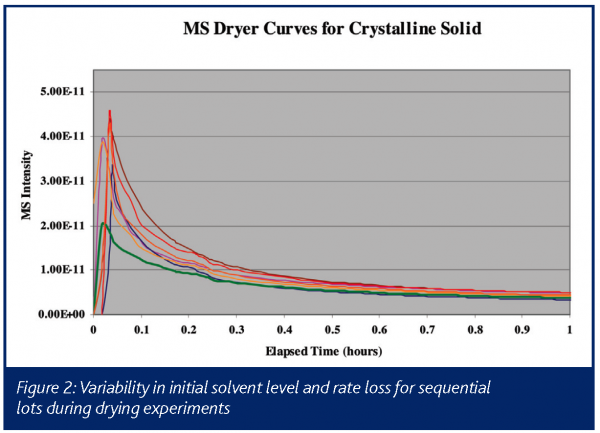
An example of the type of data obtained in such an experiment is illustrated in Figure 1, which shows drying curves obtained on a commercial product in full-scale manufacturing equipment. This chart shows a typical dryer curve, which is a plot of solvent intensity as a function of time. The solvent intensity is typically either the absolute mass spectral signal for an ion from the solvent, or the intensity of the ion scaled against a matrix ion, which is generally introduced to the dryer at a known rate (e.g. a nitrogen or argon purge). In this instance, the mass spectral signal at m/z = 31 from ethanol is plotted during the vacuum drying of material crystallized in ethanol. The x-axis is time in hours, with the arrows indicating when the product is determined to be dry based on an in-situ mass spectrometer and an empirically derived drying time based on historical experience, using a hold time triggered by pressure and temperature setpoints (Curve). In this example, the drying cycle can consistently be reduced by 2-4 hours (15-30%), based on the real-time process mass spectral measurement. In addition, the left-hand side of the chart (i.e. the 2 to 8 hour range) illustrates the variability in both initial solvent amount and in the rate of removal, which could be used to further optimize this process. This is shown more clearly in Figure 2, which is a blow-up of just the first hour of drying on seven consecutive lots of material. Having the complete process data, including the initial solvent concentration off of the filter that follows crystallisation, will allow operations personnel to correlate variability to known process conditions in real-time, allowing for the efficient optimisation of drying and the upstream processes.


Monitoring a solvent exchange process
Another common unit operation in bulk manufacture is the displacement of one processing solvent by distillation and subsequent addition of a second solvent. In many such solvent exchange operations, the intention is to reduce the original solvent level to an appropriate concentration for downstream processing. Due to changes in vessel geometry and agitation limitations, distilling to a specific volume can be difficult to predict or model when progressing through incrementally larger scales of equipment during development. Controlled distillation to a specific concentration frequently requires a lengthy laboratory assay that idles the equipment.
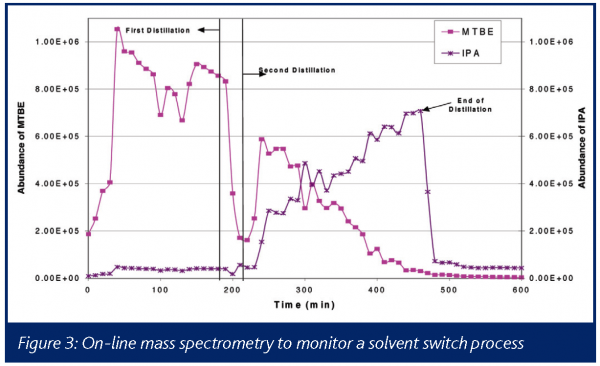
Real-time analysis of a distillate stream has been described using NIR28, and the authors were able to demonstrate stable operation over two months in pilot scale equipment. Figure 3 illustrates the use of a process mass spectrometer for this application. Characteristic ions from the initial solvent (MTBE) and the final solvent (IPA) are plotted as a function of time. As is readily seen in this chart, the MTBE fraction of the headspace drops over time as it is preferentially distilled out of the vessel, and the IPA fraction gradually increases, particularly after the vessel is re-charged (denoted by the line labeled Second Distillation). By knowing the relative response of the respective solvents in the mass spectrometer, one can determine the head space concentration and infer the liquid concentration, eliminating the need to extract samples for laboratory assay and enabling real-time forward processing.

Probing the mechanism of a reaction to ensure a safe process
On-line mass spectrometry is often invaluable in the detection of hazardous gases generated during a chemical process. In work performed by Butchko et al.29, a commercial process was investigated after a previously undetected pressure buildup was observed. The process involved the conversion of an alcohol to an alkoxide using sodium hydride (NaH) at 25°C with dimethyl sulfoxide (DMSO) as the solvent. It is known that NaH and DMSO will react to generate hydrogen gas and dimsyl anion, which is commonly used as a reactive intermediate30, but that application is usually carried out at elevated temperatures. In addition to the potential hazards associated with the rapid generation of hydrogen gas, at 80°C the production of dimsyl anion poses a safety risk due to its high rate of decomposition . However, at 25°C the reaction was expected – and historically observed – to be kinetically noncompetitive with the desired reaction to generate the alkoxide.
As part of a root cause investigation into the unexpected pressure build-up, discussions with the supplier of the NaH revealed that they had changed their process to improve efficiency and quality. The timing of the supplier’s process change corresponded with the appearance of the pressure rise.
Multiple experiments were performed in an attempt to determine the identity of the gas or gases causing the pressure increase. A benchtop quadrupole mass spectrometer was interfaced with a 1-L reactor vent via a heated capillary, and NaH was added quickly to DMSO. Using a known, constant argon flow as an internal standard, the evolution rate for hydrogen was measured. The results can be summarized by the two ion chromatograms for m/z 2 shown in Figure 4. These results show the much more rapid generation of hydrogen gas using NaH from the supplier’s modified process as compared to the legacy process.
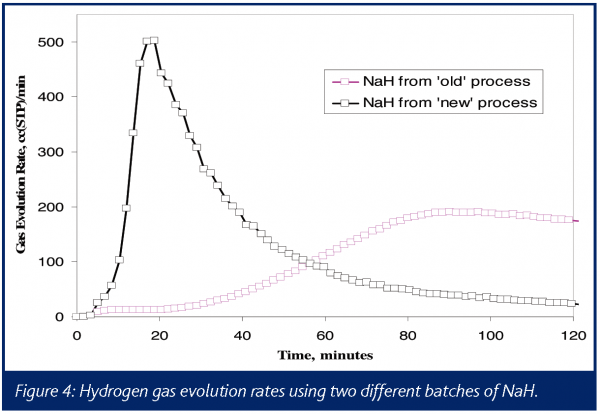

Methane was also observed in the mass spectra of the vent gases, showing an even faster rate of formation than the hydrogen. However, the peak rate of hydrogen evolution was on the order of 200 times faster than that of methane, suggesting that any hazards associated with methane were significantly less. In addition, FTIR was used to detect the formation of dimsyl anion, which tracked the formation of hydrogen, providing a mass balance determination for this reaction.
Although no exact cause of the differences in the reaction dynamics when using the supplier’s ’new‘ versus ’old‘ NaH was identified, these findings resulted in a change in the commercial process to manufacture the drug.
Understanding reaction mechanisms: Boc-deprotection
Among the more common reactions in the fine chemical industries are the t-butoxycarbonyl (Boc) protection and deprotection of an amine group of a substrate . Typically, the acid-catalysed deprotection reaction produces the free amine, carbon dioxide, and isobutylene, as shown in Scheme A.


Understanding this reaction is important for maximizing yield, minimizing additional reactions and impurities, and reducing emissions to the environment. Dias et al. have employed on-line mass spectrometry to study the deprotection reaction in order to reduce isobutylene emissions33.
Often times, insights into the overall reaction mechanism can be obtained by mass spectrometric monitoring of the reactor headspace or the vent. Doherty et al. have presented three examples of this34. For example, it is known that t-butyl cation is the intermediate to the formation of isobutylene in a typical deprotection process. This cation can readily react with a nucleophile. Figure 5 shows gas evolution profiles for a hydrochloric acid catalysed deprotection reaction where, in addition to CO2 and isobutylene, t-butyl chloride is observed. To control and safely operate a commercial scale process, it is important to understand and be able to affect the fate of the impurities generated.
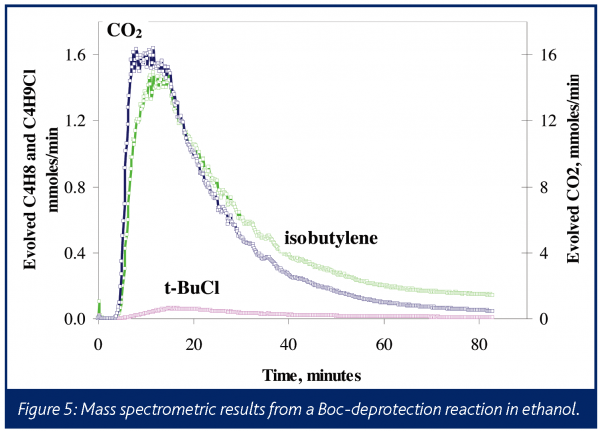

The expected stoichiometric formation of CO2 and isobutylene are not observed here because, in this case, the ethanol solvent reacts with the t-butyl cation to yield the ethyl-t-butyl ether. This speculation was confirmed by the identification of the expected fragment ions from this species in the head-space mass spectrum. This side reaction was unanticipated, and the real-time analysis afforded by in situ mass spectrometry helped more efficiently deduce the reaction mechanism accounting for low yield. Even when competitive reactions are known to occur, using an information-rich and capable technique, such as in situ mass spectrometry, can allow scientists to compress the development timeline by characterising multiple species in real-time and avoiding lengthy laboratory assays.


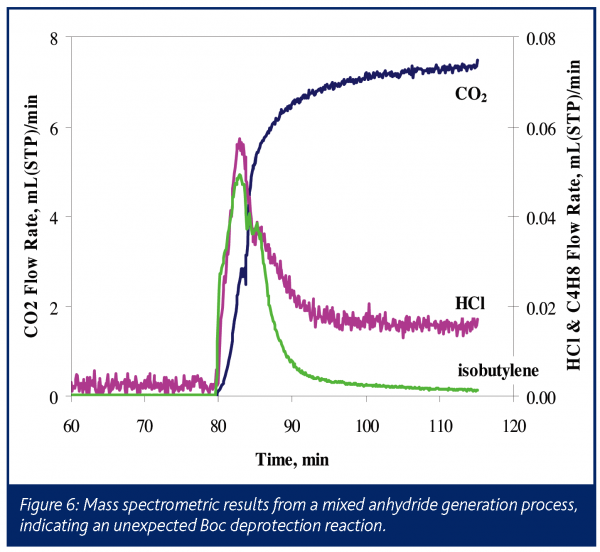
In a second application, a Boc-protected amino acid salt served as a substrate in the formation of a mixed anhydride. The liquid phase of this reaction was monitored by FTIR to obtain kinetic information. Although no gas phase products were expected, the reactor headspace was monitored by mass spectrometry, as seen in Figure 6. Reaction initiation yielded an instant release of relatively small amounts of CO2 and isobutylene, indicating that the Boc group protecting the amine was decomposing. At the same time it was noted that HCl gas was detected in the headspace. This HCl was either introduced with the acid chloride or was formed as a byproduct during the reaction with the amino acid. Although the amount of degradation was small, it is wise to understand its source to ensure that it does not become significant in future reactions, as this undesired reaction has a direct impact on yield.

In a third example, a process in the early stages of development included the Boc deprotection reaction proposed in Scheme C.
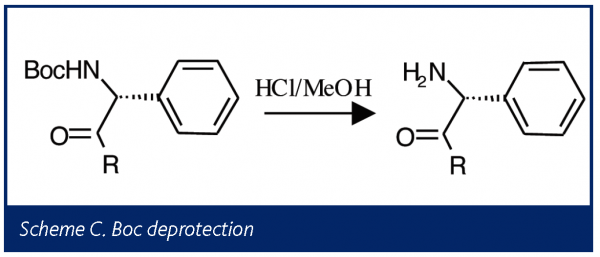

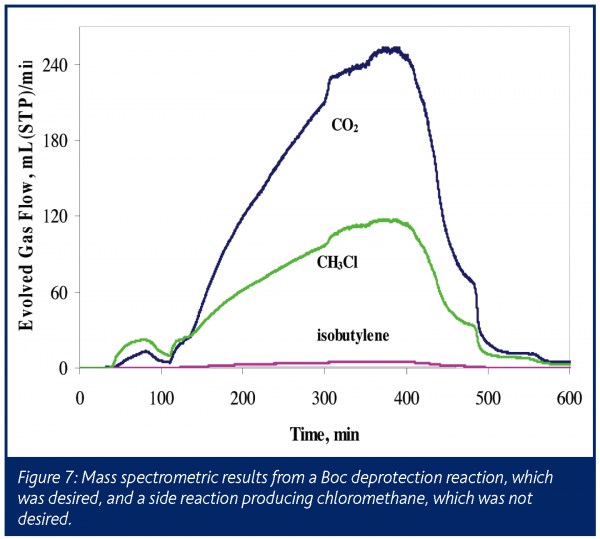
This process was performed with on-line mass spectrometry monitoring the reactor vent. The mass spectrometric analysis, shown in Figure 7, clearly indicates the presence of the expected CO2 and isobutylene. However, a large amount of methyl chloride was also detected, indicating a previously unknown and unwanted side reaction in this very reactive system. Solvent scrambling resulted, with the ethyl acetate co-solvent converting almost entirely to methyl acetate (confirmed by off-line NMR analysis following reaction completion). Prior to scale-up, this process underwent several modifications as a result of these findings.

Phosgene I: Acylation with triphosgene
Phosgene is a highly toxic gas, while triphosgene – a solid – is considered a much less serious respiratory tract irritant as a dust35. For this reason, many chemical manufacturers have been replacing phosgene with the much less hazardous alternative in the development of new processes and products. Concerns have been raised that under some conditions, triphosgene may decompose to release phosgene36. This concern was tested under various conditions by others, but no phosgene was detected using multiple analytical techniques37.
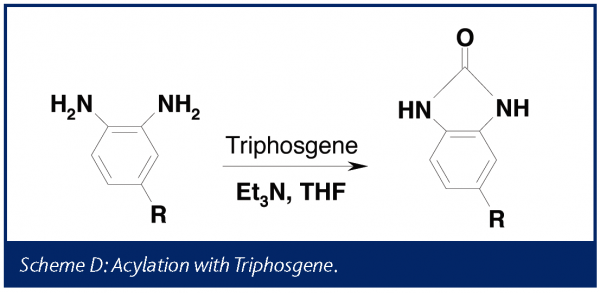
During the development of a new chemical process, the following generalised reaction was carried out using triphosgene to generate the acyl bridge in scheme D. Prior to scaling the process up from the lab to the pilot plant, it was desired to obtain gas phase data for this reaction.

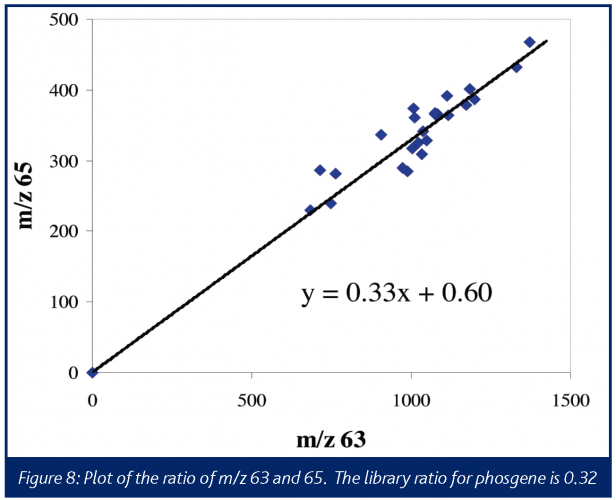
A typical electron ionisation mass spectrum for phosgene produces the most abundant ions at m/z 63 and m/z 65, corresponding to the COCl+ fragments. The characteristic one-chlorine pattern 35Cl: 37Cl can be quite useful in providing more confidence in assignments of these ions to phosgene. The m/z 63:65 intensity ratios for phosgene is 0.3238. The boiling points for phosgene and triphosgene are 8.2°C and 203-206°C, respectively, therefore no interferences would be expected from triphosgene in a reaction performed at 80°C.
After allowing the phenyl diamine, triethylamine, and THF to equilibrate, the triphosgene was added to the 2-L reactor. The responses were relatively weak, but as shown in Figure 8 (a plot of m/z 63 vs. m/z 65 abundances) these ions are in the correct ratio for phosgene, within a reasonable degree of confidence. It is also important to note that the ratio of these two ions remains relatively invariant throughout the run. Confirming the presence of phosgene and providing an approximate amount allowed for the specification of an appropriate mitigation device.

Phosgene II: Acylation with oxalyl chloride
Under some conditions oxalyl chloride has been shown to decompose to generate phosgene39. The chemistry generalized in Scheme E was studied at the one liter scale using on-line mass spectrometry prior to transferring the process to the pilot plant.


In this instance, the presence of signal at m/z 63 and 65 might be taken to indicate that phosgene is once again produced. However, the relative abundance of the two ions was seen to be incorrect for phosgene (0.32 library, 0.66 experimental). This process was run in a toluene solvent, and toluene provides fairly low level fragments at these masses with a relative abundance ratio of 0.6639. As seen in Figure 9, the ratio of these ions is consistent with the ratio expected if all the signals were attributable to toluene, confirming that no phosgene was generated in this process. Although a caustic scrubber was already being designed to handle the HCl, this data demonstrated no additional excess capacity was required for treating phosgene.


Conclusions
Process mass spectrometry is a good complement to many of the other common PAT techniques, and it has been shown to be an appropriate technology for a number of process monitoring and control applications. With continued development in both fundamentals (e.g. ionisation) and in hardware (e.g. vacuum systems engineered for micro-analysers), it seems likely that the diversity of installations will once again expand, similar to the increases seen with past technological advances, such as the emergence of the microprocessor and the appearance of benchtop instrumentation.
References
- Robinson, C. F. Chem. Eng. 1951, 58(12), 136-7,141.
- Escher, E.E. and Landsberg, H., Vacuum 1953, 3(4), 420-423.
- a) Childs, H., An American Genius: The Life of Ernest Orlando Lawrence, Father of the Cyclotron, E.P. Dutton & Co., Inc., New York, NY, 1968. b) http://www.pitt.edu/~sdb14/atombomb.html
- Scrivens, J.H. and Ramage, J.C., IJMSIP 1984, 60(1), 299-306.
- Walsh, M.R. and LaPack, M.A., ISA Transactions 1995, 34(1), 67-85.
- Beebe, K.R., et al. Anal. Chem. 1993, 65, 199R-216R.
- Blaser, W.W., et al. Anal. Chem. 1995, 67, 47R-70R.
- Workman, J. Jr., et al. Anal. Chem. 1999, 71, 121R-180R.
- Workman, J. Jr., et al. Anal. Chem. 2001, 73, 2705-2718.
- Badman, E.R. and Cooks, R.G. J. Mass Spectrom. 2000 35, 659-671.
- http://nobelprize.org/chemistry/laureates/2002/ public.html
- Colgan, S.T. et al. Talanta 1996 43(6), 851-857.
- Brum, J. and Dell’Orco, P. Rapid Commun. Mass Spectrom. 1998, 12, 741-745.
- Dell’Orco, P.; Brum, J.; Matsuoka, R., Badlani, M.; Muske, K. Anal. Chem. 1999, 71, 5165-5170.
- Brum, J.; Dell’Orco, P.; Lapka, S.; Muske, K.; Sisko, J. Rapid Commun. Mass Spectrom. 2001, 15, 1548-1553.
- Takats, Z.; Wiseman, J.M.; Gologan, B.; Cooks, R.G. Science 2004, 306, 471-473.
- Chen, H.; Talaty, N.N.; Takats, Z.; Cooks, R.G. Anal. Chem. http://pubs.acs.org/cgi-bin/asap.cgi/ancham/asap/pdf/ac050989d.pdf
- http://www.jeolusa.com/ms/msprods/accutof_dart.html
- Cody, R.B.; Laramee, J.A.; Durst, H. D. Anal. Chem. 2005, 77, 2297-2302.
- Doherty, S. J.; Kettler, C. N. in Process Analytical Technology in Bakeev, K.A. (ed.) Process Analytical Technology; Blackwell Publishing Ltd.; Oxford, UK, 2005; pp. 341-342.
- White, J. G. Pharm. Res. 1994, 11, 728-732.
- Coffey, C.; Predoehl, A.; Walker, D. S. Appl. Spectrosc. 1998, 52, 717-724.
- Parris, J.; Airiau, C.; Escott, R.; Rydzyk, J.; Crocombe R. Spectroscopy, 2005, 20(2), 34-42.
- Green, R. L.; Thurau, G.; Pixley, N. C.; Mateos, A.; Reed, R. A.; Higgins, J. A. Anal. Chem. 2005, 77(14), 4515-4522.
- Colin, Todd. AT-PROCESS, 1997, 3(1,2), 63-70.
- Hettenbach, K. et al. OPR&D 2004, 8, 859-866.
- Hettenbach, K. et al. OPR&D 2004, 8, 867-872.
- Ge, Z. et al. Procecc Contr. Qual. 1999, 11, 277-287.
- Butchko, M, Borden, D., LaPack, M., and Miller, C.; Manuscript in process.
- Corey, E. J. and Chaykovsky, M.; JACS, 1965, 87 (6), 1345.
- Bretherick’s Reactive Chemical Hazards Database version 3.0 (electronic). Topic: Dimethyl sulfoxide (Sulfinylbismethane). Subtopic: Sodium Hydride.
- Greene, T. W. and Wuts, P. G. M.; Protective Groups in Organic Synthesis, 3rd Ed., Wiley, NY, 1999.
- Dias, E. L., Hettenbach, K. W., and am Ende, D. J.; OPRD, 2005, 9 (1), 39.
- Doherty, S. J., Presented at International Forum on Process Analytical Chemistry, 2004
- a) Material Safety Data Sheet, Phosgene, VanDeMark Chemical Co., Inc., One North Transit Road, Lockport, NY 14094, Effective Date: 25-Jan-2005. b) Material Safety Data Sheet, Triphosgene, Lancaster Synthesis Ltd., P.O. Box 1000, Windham, NH 03087-9977, Effective Date: 06-Jan-2000.
- Damle, S. B., Chemical & Engineering News, (8 Feb 1993) 71(6), 4.
- Cotarca, L., Org. Process Res. Dev., 1999, 3(5), 377.
- NIST/EPA/NIH Mass Spectral Library, Data Version NIST 02: a) Phosgene, Entry Number 3357; three database spectra averaged. b) Toluene, Entry Number 3357; seven database spectra averaged.
- Ennis, M. D.; Encyclopedia of Reagents for Organic Synthesis; Ed. L. A. Paquette; John Wiley & Sons, Ltd.: Chichester, 1995; vol. 6; pp 3814.


