New opportunities for understanding
Posted: 23 May 2006 | | No comments yet
By taking advantage of new technology previously developed mainly for radio astronomy, biological investigations and military applications, the emerging field of Terahertz (THz) Spectroscopy is starting to make its way into pharmaceutical analysis. This overview describes the new opportunities with THz Spectroscopy for rapid and non-destructive analysis of pharmaceutical materials such as powders and tablets.
By taking advantage of new technology previously developed mainly for radio astronomy, biological investigations and military applications, the emerging field of Terahertz (THz) Spectroscopy is starting to make its way into pharmaceutical analysis. This overview describes the new opportunities with THz Spectroscopy for rapid and non-destructive analysis of pharmaceutical materials such as powders and tablets.
By taking advantage of new technology previously developed mainly for radio astronomy, biological investigations and military applications, the emerging field of Terahertz (THz) Spectroscopy is starting to make its way into pharmaceutical analysis. This overview describes the new opportunities with THz Spectroscopy for rapid and non-destructive analysis of pharmaceutical materials such as powders and tablets.
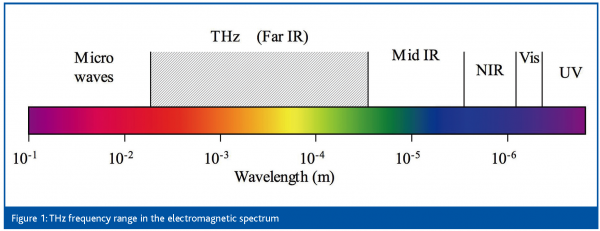
The term ‘TeraHertz’ (THz) refers to an optical frequency range that lies between the long wavelength limit of the infrared and the microwaves, roughly covering 0.3 to 3 THz (10 to 100 cm-1), see Figure 1. Based on recent developments of new devices for emitting and detecting radiation in this spectral region, new tools for conducting spectroscopy of pharmaceutical materials have now become available. This spectral region constitutes the basis for new opportunities for advanced characterisation of chemical and physical properties of pharmaceuticals. As such it fills a gap in the spectroscopic analytical tool-box.
THz spectroscopy adds new opportunities to the previously established techniques: NIR spectroscopy, Raman spectroscopy and mid IR spectroscopy, in particular for rapid and non-destructive analysis of solids and semi-solids.
The history of THz spectroscopy
Historically, THz has been a difficult region of the spectrum to investigate. It is only recently, with the development of novel THz optical devices, that new analytical instrumentation could be developed to make the measurements routine. In scientific research, applications in biology and medicine have gradually emerged since the mid-1990s1. Historically, research in the THz region has been confined mostly to astrophysics and lately to military and safety applications and this is still the case even though applications in biology and medicine have gradually emerged since the mid-1990s1. Conventionally, the spectroscopy carried out over the spectral range of 10 to 400 cm 1 has been known as far infrared (far-IR) and research interest in this field has existed since the 1960s2. This interest stemmed from the fact that light in this part of the spectrum directly probes low energy motions in molecules and molecular crystals and has been used to study low frequency intramolecular modes3, H-bonding4 and crystal lattice vibrations5, 6. A major difficulty with the conventional approach to far-IR measurements is that the energies detected are small compared to the blackbody background emission in the measurement. Despite this difficulty, there has been some application development of far-IR in key areas of material science such as semiconductors. However, in the field of pharmaceuticals, it has received little attention despite the fact that specific structural and dynamic features can only be directly observed in the far IR. The opportunities for far IR and the lack of application development were recently identified7.
The development of THz technology has opened up new opportunities for routine spectroscopy in chemical and materials analysis8. Table 1 summarises different methods of THz spectroscopy and the respective application areas. Spectral data in the THz region is rich in information about molecular and intermolecular structure and interactions of great relevance to pharmaceutical materials characterisation. Of particular interest is crystal structure and morphology, hydrates and solvates, H-bonding and molecular structural dynamics. THz is sensitive to the presence of crystalline materials since vibrations of the crystal lattice (phonons) have strong resonant frequencies in this range9. The phonon frequencies are dependent upon the spatial relationship and interaction of the molecules in the crystal unit cell. Even small changes in crystal structure and hence morphology can be characterised from the THz spectrum10.
Pharmaceutical analysis
With new advances in THz instrumentation, the development of new applications in pharmaceutical materials characterisation becomes possible. The need, for example, for non-contact methods for solid state characterisation has started to generate published work on polymorph identification, solid state characterisation of formulated products as well as imaging of layers and coatings. Table 2 gives an overview of different categories of application of THz spectroscopy in pharmaceutical analysis exemplified by selected references, discussed further below.
Taday et al.10 reported the use of THz spectroscopy for differentiation of two polymorphs of ranitidine hydrochloride in formulated products. The samples were mixed with polyethylene and compressed as discs for transmission measurements. The results showed significant differences between the two forms although no assignment of the THz absorption bands was made. Taday11 reported on the use of chemometric analysis of THz spectroscopic data of pharmaceutical tablets to demonstrate its quantitative capability. Tablets containing 4-acetamidophenol and acetylsalicylic acid were measured and PLS models were developed with cross validation prediction errors of 2.85 and 3.9 per cent, respectively. Strachan et al.9 presented THz transmission measurements of pharmaceutical substances carbamazepine, enalapril maleate, indomethacine and fenoprofen calcium and demonstrated that different solid state forms could be differentiated using THz spectroscopy. They concluded that a lack of spectral features in the THz region of amorphous and liquid crystal samples, as opposed to crystalline samples, was due to the excitation of phonon modes in crystalline samples. Day et al.12 used low-temperature THz spectroscopy and harmonic lattice dynamics calculations to study the phonon modes of the four polymorphs of carbamazepine. Their work demonstrated the usefulness of low-temperature measurements for enhancement of spectral structures in the THz region and they were able to show good correlations with predicted values for polymorphs I and III. Peak assignments of features in the 10-100 cm-1 spectral region provided insight to differences in molecular motions of the different polymorphs of carbamazepine.
Fitzgerald et al.13 reported on the first use of terahertz pulsed imaging on pharmaceuticals in an investigation of two different brands of ibuprofen tablets. The concept of THz pulsed imaging (TPI) for tablet coating determination was shown and both coating thickness and uniformity at 30 µm depth resolution and 150 µm lateral resolution was presented. It was concluded that TPI for tablets is non-destructive, non-invasive, fast and provides useful bioavailability information. Fischer et al.14 reported on the successful recognition of cocaine, morphine, and lactose in sealed containers using THz transmission spectroscopy. They further demonstrated the contact-free recognition of lactose, aspirin, sucrose and tartaric acid pellets hidden in containers using THz transmission imaging. A recognition coefficient defined in the paper was necessary for the identification and discrimination of the images of the four substances. Shen et al15 measured reflectance THz images of pure sucrose, pure lactose and their mixture pellets compressed with high-density polyethylene. It was found that THz transmission spectra, available from spectral libraries, could be used for data processing of the reflectance images. This work demonstrated that THz imaging at reflectance mode could be used to obtain spatial distribution of individual chemical components in a heterogeneous mixture. The authors also reported that THz images at reflection mode could be successfully measured at situations when the sample became opaque and THz images at transmission mode could not be obtained.
Instrumentation
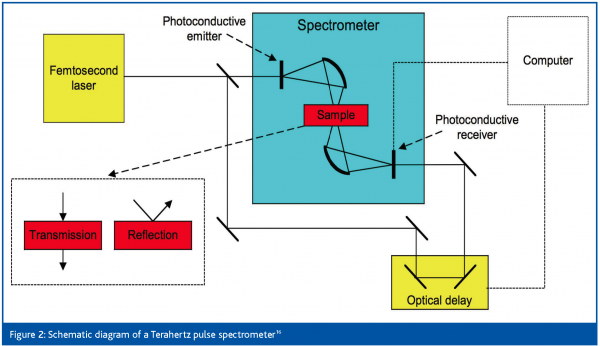
As has been mentioned, the difficulty of using far-IR spectroscopy for materials characterisation has been mainly related to limitations of conventional optical hardware. Recent developments in THz technology have made measurements in this region feasible and routine. These developments have arisen from advances in ultra-short pulsed lasers and semiconductor emitters and receivers16. The principle of Terahertz Pulse Spectroscopy (TPS) is shown in Figure 2. A femtosecond laser generates ultra short NIR pulses which are further focused on to the photoconductive emitter generating electron-hole pairs on the semiconductor surface. The applied DC electric field on the emitter accelerates the generated electron-hole pairs inducing bursts of THz radiation from the emitter with each laser pulse. The THz emission is collected and focused through silicon lenses and used for transmission or reflection spectroscopy. A small part of the femtosecond laser pulse is redirected to a photoconductive receiver through a fast optical delay line thus generating electron-hole pairs in the receiver. The electric field provided by the coincident THz pulses generates photocurrent which is measured at the receiver. By sweeping the optical delay of the short laser pulses through the duration of the THz pulse, a time domain reconstruction of the THz signal is achieved. The time domain responses are Fourier transformed to give the spectra of the sample and the reference. The absorbance spectrum is determined in the same way as in infrared spectroscopy and the resulting spectrum represents the response of the sample. Examples of THz instrumentation can be found in references11,16-17.
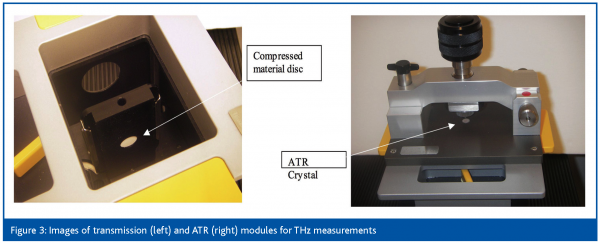
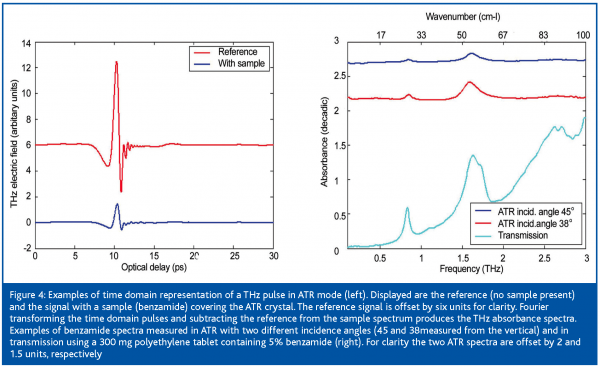
Transmission measurements are performed on compressed discs of the sample material diluted in a far-IR transmitting matrix such as polyethylene. Conventional reflection methods for infrared absorption measurements are Attenuated Total Reflection (ATR) and diffuse reflectance. Diffuse reflectance has not yet been demonstrated for THz, however, ATR is showing promise as a potential method for characterising powders, formulated products and liquids. Details of ATR can be found elsewhere18 but essentially consists of a high refractive index sampling accessory (silicon) onto which the sample of interest is placed. Light is internally reflected within the silicon and the interaction of the resulting evanescent wave with the sample gives an absorption spectrum of that sample. Images of transmission and ATR modules are shown in Figure 3. ATR is a more practical approach compared to transmission mode, since the substance can be placed directly on the ATR crystal when measured, while the transmission measurements require some initial sample preparation. Figure 4 (left) displays examples of THz pulses of a reference signal (no sample) and a signal with a sample (benzamide) present on the ATR crystal. Note the decrease of the signal amplitude due to the attenuated reflection in presence of the sample. Figure 4 (right) is a comparison of the benzamide spectra obtained using ATR measurements with two different incidence angles and a transmission measurement. The units used to represent this difference spectrum are a log10 ratio of the sample versus the reference absorption spectra (decadic16). As observed, the transmission measurement has the highest sensitivity followed by the ATR with angles of incidence closer to the vertical. The higher sensitivity for angles closed to the vertical is due to the larger depth of penetration of the ATR evanescent wave for these angles. In Figure 4 (right) the baseline offset in the transmission spectra is due to the polyethylene used as a dilution matrix. Mixing is required in cases of materials with strong absorptions. For a technique to be truly useful in a modern pharmaceutical laboratory, aspects such as substance consumption, robustness and ease of sample presentation etc. play an important role. Using the ATR modules, sample presentation is simplified and substance requirements are decreased.
Prospects including process analysis
The recent advances in THz technology emphasise the good prospects for THz measurements in general. However, to widen its utility in pharmaceutical analysis further research in THz science and development of specific technologies are required. Two particular areas that are likely to see significant progress are development of the theoretical basis for THz spectroscopy and the development of technology and applications for process analysis.
From an analytical perspective THz is ideal for characterising pharmaceutical polymorphs. However, the relationship of THz absorptions to specific molecular motion in phonon modes is not well understood and there is a need to develop good theoretical and experimental approaches to give this understanding. Tools are available to perform ab initio calculations of internal vibrational modes of the free molecule to predict the infrared absorption spectrum. However, calculations for the lattice dynamics of crystals of small organic molecules is not yet well developed. Recent calculations have shown the success of this approach in predicting phonon modes for polymorphs of carbamazepine12. It is certainly becoming feasible to perform these calculations and to visualise the lattice vibrational modes. Future improvements in the prediction of internal and external modes and their mixing will help further understand the spectral data obtained.
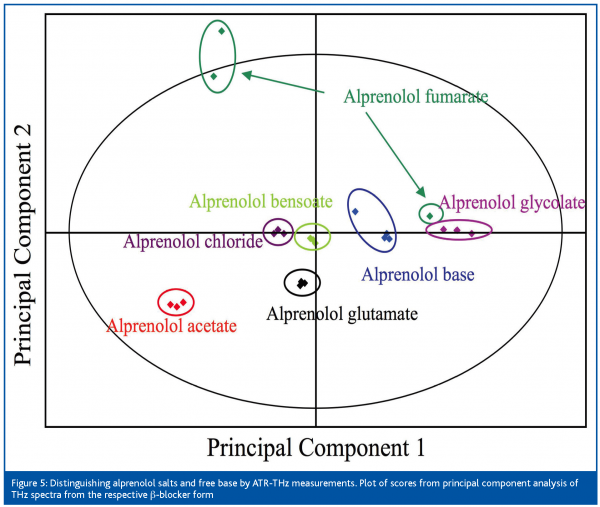
In the pharmaceutical industry Process Analytical Technology (PAT) has developed, during recent years, into a strategic area that will have a major impact on the industry’s future way of operating20,21. PAT enables quality of materials and processes to be assessed both in real-time and in more depth. Although it will improve manufacturing it will also enable efficient development and predictive scale-up. So far, there are only a few applications discussed in the scientific literature11 of THz spectroscopy to process analysis. In the PAT context, THz measurements constitutes some interesting features such as non-destructive analysis of solids and semi-solids as well as sampling times as short as down to hundreds of milliseconds. In all this leads to possibilities for high throughput analyses, which are key in monitoring and control applications. Ultimately this allows for process intervention if needed. An additional feature is that common packaging materials (e.g. plastics) are transparent in the THz range, which makes direct inspection of packaged materials possible. Still, in the short term the main use of THz technology will be in the area of process understanding based on its use in advanced material characterisations. One excellent example of this is non-destructive analysis of coating thickness on intact pharmaceutical tablets, as presented by Fitzgerald et al19. Here THz measurements in the pulsed imaging mode made it possible to measure the coating thickness down to ca. 30 µm. There is potential for extending the utility of THz imaging into chemical mapping of solid materials. Yamashita et al.22 used two-dimensional electro-optic THz imaging where they obtained trans-illumination THz images that allowed for determination of chemical composition and concentrations in mixtures. As discussed above, THz spectroscopy has the ability to distinguish chemical materials that differ only in physical state. This can be taken advantage of both in spectroscopic and in imaging applications, for example allowing for determination of spatial distributions of different ingredients in composite samples such as tablets, capsules and granules. Furthermore, this presents new opportunities for monitoring changes in the physical state of a chemical as an effect of processing, e.g. changes in the polymorphic form of the active pharmaceutical ingredient23. The adequate strategy for when and where to apply THz measurements in tablet manufacturing will largely follow that which has previously been proposed for Raman spectroscopy24. That is, for crystallinity/polymorphism, granulation, drying or compression may constitute critical process steps due to risk of hydration or dehydration, or induction of heat. In addition, the correct identity of the active pharmaceutical ingredient with respect to both its chemical and physical properties can also be assessed by THz measurements in PAT applications. This is exemplified in Figure 5 where different forms of the βblocker alprenolol could be clearly distinguished based on the information carried in their THz spectra. Six crystalline salts of alprenolol, as well as the crystalline free base, were measured non-destructively by ATR-THz spectroscopy without the need for any sample preparation. The spectra were thereafter analysed by Principal Component Analysis (PCA).
Paving the way
The promising developments in THz instrumentation, together with the successful first results on pharmaceutical applications, emphasise the good prospects for THz measurements. It is therefore easy to envisage that the recent advances will pave the way for a broader usage of THz technology in the future, particularly related to solids and semi-solids material characterisations. The use of THz technology in pharmaceutical analysis thus offers new opportunities for material and product understanding during pharmaceutical development and for advanced manufacturing control.






References
- P.H. Siegel, Terahertz Technology in Biology and Medicine, IEEE Trans. Microwave Theory Tech. 52, 2438-2447 (2004).
- G.W. Chantry, Submillimetre Spectroscopy, Academic Press, (1971).
- J. W. Brasch, Y. Mikawa, R.J. Jakobsen, Chemical Far Infrared Spectroscopy, Appl. Spectrosc. Reviews 1, 187-235 (1968).
- R.J. Jakobsen, J.W. Brasch, Y. Mikawa, Past Results and Future Prospects of the Far Infrared Studies of Hydrogen Bonding, Appl. Spectrosc. 22, 641-649 (1968).
- A. Anderson, H.A. Gebbie, Far infrared study of molecular crystals by interferometric methods, Spectrochimica Acta 21, 883-8 (1965).
- D.H. Martin, The vibrations of crystal lattices by far-infrared spectroscopy, Advan. Phys. 14, 39-99 (1965).
- P.R. Griffiths, Far Infrared Spectroscopy, Handbook of Vibrational Spectroscopy, Vol 1: Theory and Instrumentation. Eds.: J M Chalmers, P R Griffiths, John Wiley and Sons Ltd, Chichester, p229 (2002).
- M.C. Beard, G.M. Turner, C.A. Schmuttenmaer, Terahertz Spectroscopy, J. Phys. Chem. B 106, 7146-7159 (2002).
- C.J. Strachan, T. Rades, D.A. Newnham, K.C. Gordon, M. Pepper, P.F. Taday, Using terahertz spectroscopy to study crystallinity of pharmaceutical materials, Chem. Phys. Lett. 390, 20-24 (2004).
- P.F. Taday, I.V. Bradley, D.D. Arone, M. Pepper, Using Terahertz Pulse Spectroscopy to Study the Crystalline Structure of a Drug: A Case Study of the Polymorphs of Ranitidine Hydrochloride, J. Pharm. Sci. 92, 831-838 (2003).
- P.F. Taday, Applications of terahertz spectroscopy to pharmaceutical sciences, Phil. Trans. R. Soc. Lond. A 362, 351-364 (2004).
- G.M. Day, J.A. Zeitler, W. Jones, T. Rades, P.F. Taday, Understanding the Influence of Polymorphism on Phonon Spectra: Lattice Dynamics Calculations and Terahertz Spectroscopy of Carbamazepine, J. Phys. Chem. B 110, 447-456 (2006).
- A. Fitzgerald, B.E. Cole, P.F. Taday, Nondestructive Analysis of Tablet Coating Thickness Using Terahertz Pulsed Imaging, J. Pharm. Sci. 94, 177-183 (2005).
- B.M. Fischer, M. Hoffmann, H. Helm, G. Modjesch, P.U. Jepsen, Chemical recognition in therahertz time-domains spectroscopy and imaging, Semicond. Sci. Technol. 20, S246-S253 (2005).
- Y.C. Shen, P.F. Taday, D.A. Newnham, M. Pepper, Chemical mapping using reflection terahertz pulsed imaging, Semicond. Sci. Technol. 20, S254-S257 (2005).
- P.F. Taday, D.A. Newnham, Technological Advances in Terahertz Pulsed Systems Bringing Far-infrared Spectroscopy into the Spotlight, www.spectroscopyeurope.com/THz_16_5.pdf.
- M.C. Beard, G.M. Turner, C.A. Schmuttenmaer, Terahertz Spectroscopy, J. Phys. Chem. B 106, 7146-7159 (2002).
- N.J. Harrick, Internal Reflection Spectroscopy, New York: Wiley (1967).
- A. J. FitzGerald, B. E. Cole and P. F. Taday, Nondestructive analysis of tablet coating thicknesses using terahertz pulsed imaging, J. Pharm. Sci. 94, 177-83, (2005).
- http://www.fda.gov/cder/OPS/PAT.htm
- http://www.emea.eu.int/Inspections/PAThome.html
- M. Yamashita, M. Usami, K. Fukushima, R. Fukusawa, C. Otani and K. Kawase, Component spatial pattern analysis of chemical by use of two-dimensional electro-optic terahertz imaging, Appl. Opt. 44, 5198-5201, (2005).
- P. Smith, Pharmaceutical Analysis using Terahertz Spectroscopy, Innovations in Pharm. Techn., May, 73-76 (2005).
- S. Folestad and J. Johansson, Raman Spectroscopy: Opening the PAT-toolbox, Eur. Pharm. Rev. 4, 36-42 (2003)


