Neuronal morphology screening as a tool in neuroscience drug discovery
Posted: 27 March 2007 | | No comments yet
High content screening (HCS) has now become integrated into all aspects of drug discovery from target identification and validation to hit generation and lead optimisation through to toxicological profiling. In neuroscience, the ability to perform automated neurite outgrowth and neuronal morphology screening has been a significant driver of HCS implementation. This approach has evolved significantly from relatively simple measures of total neurite length to detailed multi-parametric characterisation of neuronal morphology.
High content screening (HCS) has now become integrated into all aspects of drug discovery from target identification and validation to hit generation and lead optimisation through to toxicological profiling. In neuroscience, the ability to perform automated neurite outgrowth and neuronal morphology screening has been a significant driver of HCS implementation. This approach has evolved significantly from relatively simple measures of total neurite length to detailed multi-parametric characterisation of neuronal morphology.
High content screening (HCS) has now become integrated into all aspects of drug discovery from target identification and validation to hit generation and lead optimisation through to toxicological profiling. In neuroscience, the ability to perform automated neurite outgrowth and neuronal morphology screening has been a significant driver of HCS implementation. This approach has evolved significantly from relatively simple measures of total neurite length to detailed multi-parametric characterisation of neuronal morphology.
Neuronal morphology and function
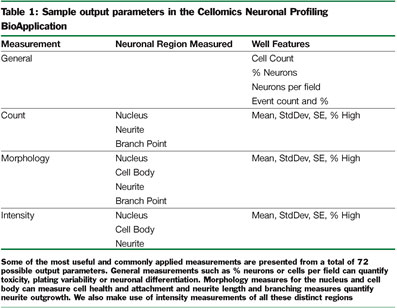
The morphology of neurons grown in culture can be highly informative about the physiological state of the cell in addition to the phenotype and is also growing in importance as a screening tool, leading to a better understanding of the function of compounds and genes in a contextual system. Current algorithms for automatic quantification of neurites and neuronal morphology allow for a vast array of output parameters (some of the key ones listed in Table 1) providing for a comprehensive phenotypic characterisation of primary or immortalised neuronal cultures. Useful measurements such as those taken from the nucleus using a fluorescent nuclear dye such as DAPI or Hoechst 33342 can be valuable in determining whether the cell is undergoing apoptosis1 or mitosis. In addition, the area and shape of the cell body can also be used to gauge the health of the cell and how well it is attaching to the surface. For example, a cell body that is more round than usual might indicate poor attachment or low viability. Staining for protein markers in the cell body is often a useful technique for segmenting different populations of cells growing together, such as neurons and glia or subpopulations of neurons expressing different neurotransmitters or receptors. The practice of measuring the neurite outgrowth of neurons has been used extensively in high-content applications to study the effect of secreted neurotrophic substances such as growth factors2-4. In addition, the environment in which the neurons grow can have a profound effect on the length of neurites. Some examples of this are the use of inhibitory substrates such as myelin, normally a component of Schwann cells that insulate axons, which mimics the environment following neurological trauma and retards neurite extension5, or stimulatory substrates such as laminin, which promote neurite outgrowth.
Available HCS systems for neuronal morphology measurements & evolution of technology
The development of integrated HCS systems from a growing number of vendors (e.g. Cellomics, Molecular Devices, Becton Dickenson and GE) in recent years has greatly increased the reach of automated microscopy beyond a few specialised cell biology labs. Important developments in the use of HCS for neuronal morphology measurements have come with improvements in software and with computer hardware able to handle these computationally intensive applications. Although all the major vendors of HCS equipment now supply software capable of measuring neurite outgrowth, the discussion here will focus on the historical development of three generations of software from Cellomics in comparison to a software package from Molecular Devices, which we also evaluated. Aside from the software available with these and other imaging platforms, there is also a wealth of information available on custom-made software that can run independently of the system used to capture images6,7. Table 2 includes some of the key features that are important for any neuronal morphology software application for HCS. Early neurite outgrowth applications such as the Neurite Outgrowth BioApplication from Cellomics were field-based and did not measure the neurites on a cell-by-cell basis, but measured all the neurites in the field of view and all the cells present in the field. This first generation HCS application is easy to use and accurately traces neurites and, as can be seen in Figure 1, with the tracing of this elaborate field of hippocampal neurons, which have been growing for seven days on a poly-lysine substrate. However, this first generation tool is not able to capture all the neurite outgrowth features and details that can be captured by manual measurements and this algorithm often has difficulty with distinguishing real neurites from a ‘dirty’ background, as might occur if the cells where plated on a crude inhibitory substrate, such as myelin. The second-generation application from Cellomics, Extended Neurite Outgrowth (ENO) BioApplication represented a leap forward in the type of available measurements. ENO measures neurite outgrowth on a cell-by-cell basis and can therefore provide individual cellular measurements in addition to well averages and statistics used by most users. It also satisfies most of the requirements laid out in Table 2, with the exception of cell segmentation and the availability of nuclear measurements. Cellomics’ Neuronal Profiling BioApplication represents their current example of highly advanced neuronal morphology software. This new neuronal morphology application meets all the key requirements outlined on the list and has improved speed compared with previous generations, which can become a key feature when undertaking a large scale screening effort. In addition to what can be considered key features, this new package also offers some additional useful features. These include giving the user a choice of neurite identification methods and in addition to population segmentation based upon a second dye it can segment up to three cellular populations (using Boolean logic) from an analysis using any combination of measurement parameters and generate a unique set of morphology readouts for each subpopulation. In Figure 1, the neuronal profiling software is able to identify neurites with a similar degree of accuracy in a complex culture as the first generation software, but delivers a wealth of information on morphology at the well and cell detail levels.
In comparison, an image captured on a Molecular Devices Image Express instrument in the same well and in close proximity to the image captured for the comparison of Cellomics software is presented. The Molecular Devices Neurite Outgrowth application is based upon Metamorph image analysis software and will therefore have an interface familiar to those with a microscopy background. As with the Neuronal Profiling application, this application was able to accurately identify neurites in a complex culture (Figure 1) and generate cell and well-based outputs. The Molecular Devices tool has fewer available output features than the Cellomics Neuronal Profiling tool, which may not be an issue if users are not observing a wide range of different phenotypes in their assays outside of a change in neurite outgrowth.
Neurite imaging and synaptic spines
Probably the most widely used technique for neuronal morphology measurements are to immunostain the neuron for neuro-specific proteins associated with the cytoskeleton, such as β-III-Tubulin, MAP2 or Tau. These proteins are abundant and restricted to neurons, therefore not labeling any contaminating cells present in the culture; they are also present in most of the cell body and processes allowing for quantification of the entire cell. Automated morphology analysis requires that neurons be plated sparsely with considerable space between their neighboring cells to allow all developing features, particularly neurites, to be clearly visible, measurable and attributable to its parent cell. As neurons and their processes tend to spread throughout the field, images must be gathered at relatively low magnification to gather sufficient cells for analysis. Neuronal cellular measurements can be quite variable from one neuron to another when using primary cultures and we find that in order to truly assess the status of the culture as a whole, at least 200 neurons/well must be measured for accurate statistical analysis. As a result, most automated neuronal morphology applications work best at either 5X or 10X magnification. For cortical neurons plated at 15,000 cells/cm2 (5000 cell/ well in a 96 well plate), 5-6 fields are typically needed to capture 200 neurons at 10X magnification.
The purpose of neurons extending processes is to make functional synapses with other neurons. This increased number and strength of synapses is typically evaluated on their electrical properties using electrophysiology, a discipline where high-content methods are in their infancy. Imaging methods can be used to determine neuronal activity such as measuring Ca-flux in neuronal cultures8. Another approach as a surrogate for measuring the functionality of neurons using HCS methodology is to immunostain the dendritic spines for a protein localised to these structures, such as synaptophysin (Figure 2). There are currently no pre-packaged software algorithms that can measure neurite processes and the dendritic spines, which is a weakness of the current state of the art. It is, however, possible to use separate applications to measure neuronal morphology and then measure the number of spines with an application capable of measuring and quantifying spots–such applications being available on most HCS systems.
Small molecule screening for neurite outgrowth
The advantage of a high-content morphology based screen is that this approach is not hypothesis driven and is likely to yield new therapeutic approaches to the treatment of neurological disorders. As examples of neurite outgrowth promotion assays, two such studies have yielded proof-of-concept data for this approach in screening for small molecules capable of promoting neurite outgrowth in human neural stem cells 8 or primary rat cortical neurons shown in Figure 39.
We performed such a validation screen using primary rat cortical neurons derived from day 18 rat embryos using the commercially available Library of Pharmacologically Active Compounds (LOPAC) from Sigma-Aldrich. The initial screen was run using a single concentration (10µM) in a single well (Figure 3) on three separate days. Compounds of interest were determined based upon statistical significance from the control wells, which received DMSO alone. These lead compounds were then run in a multi-concentration format, with triplicate wells for each concentration. This approach was able to determine the most effective concentration of each compound and also further identify false positive hits from the single-point assay. Hits from the multi-concentration assay were analysed using multiple parameters available in the Neuronal Profiling BioApplication (Figure 4). In particular, an increased branching of neurites reports the overall complexity of the neuronal network to be increasing, which might lead to an increased potential to make new synapses. Measures of cell health were also captured in the form of total number of neurons and the fluorescent intensity of the nucleus, which will increase if the cell undergoes apoptosis.
In our experience the major problem to be overcome when using primary neuronal cultures for large scale screening efforts is the need to minimise the variability inherent in the cultures when experiments may need to be performed over multiple days or weeks. Some recommended solutions that allow for the monitoring of variability include the inclusion of positive and negative controls on each plate, the measurement of a sufficient number of cells in each well and repeating the number of wells a sufficient number of times to ensure that hits can be identified.
Conclusion
Our experience with neuronal morphology at Wyeth has evolved over the last decade from the manual tracing of neurites prior to the introduction of High-Content technology, with limited and basic support for one drug discovery program to our present situation supporting multiple programs with extensive neuronal morphology parameters in both primary neurons and cell lines as indicated in this article. The continued evolution and increase in value for High-Content neuronal morphology will likely come about through an increase of functional measures associated with morphology and a deeper understanding of how these changes relate to in vivo biology.
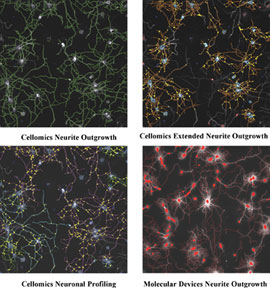

Figure 1: Comparison of neuronal measurement algorithms. Images of how well the neurite outgrowth software referred to in Table 1 trace neurites in a complex culture of hippocampal neurons that have been cultured for seven days.
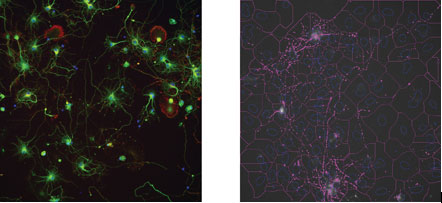

Figure 2: Morphological measurement of dendritic spines using synaptophysin staining. The left image is an example of a 7-day-old culture of hippocampal neurons stained with Hoechst 33342 (blue), anti-beta-III-Tubulin (green) and anti-synaptophysin (red). The right image is an overlay of a spot detection algorithm to measure the punctate staining of synaptophysin
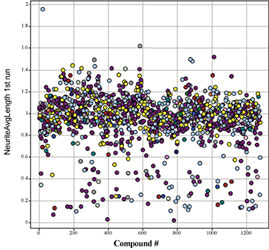

Figure 3: Typical neurite outgrowth data from a small screen. Data output from a neurite outgrowth screen performed in primary neurons screen using a commercially available library of compounds (LOPAC, Sigma). Most of the compounds tested fall within a range of neurite lengths plus or minus 20%, with compounds above this range being considered hits for neurite outgrowth. Compounds that produce shorter than normal neurites need to be evaluated with other parameters mentioned in Table 1 to determine if this is due to toxicity
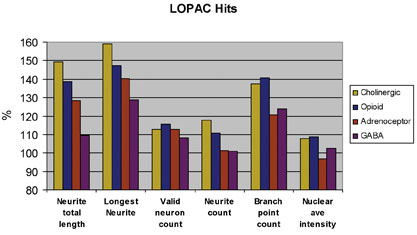

Figure 4: Multiparameter comparison of hits from LOPAC screen Compounds inducing robust neurite outgrowth are further interrogated based on multiple morphological parameters. This approach allows us to get a more accurate picture of how morphology is affected by a compound, including toxicity, number of neurites, cell number, branching, etc...


References
- Fennell, M., H. Chan, and A. Wood, Multiparameter measurement of caspase 3 activation and apoptotic cell death in NT2 neuronal precursor cells using high-content analysis. J Biomol Screen, 2006. 11(3): p. 296-302.
- Danzer, S.C., et al., Increased expression of brain-derived neurotrophic factor induces formation of basal dendrites and axonal branching in dentate granule cells in hippocampal explant cultures. J Neurosci, 2002. 22(22): p. 9754-9763.
- McIlvain, H.B., et al., Pituitary adenylate cyclase-activating peptide (PACAP) induces differentiation in the neuronal F11 cell line through a PKA-dependent pathway. Brain Research, 2006. 1077(1): p. 16-23.
- Ring, R.H., et al., Transcriptional profiling of brain-derived-neurotrophic factor-induced neuronal plasticity: a novel role for nociceptin in hippocampal neurite outgrowth. J Neurobiol, 2006. 66(4): p. 361-77.
- Filbin, M.T., Myelin-associated inhibitors of axonal regeneration in the adult mammalian CNS. Nat Rev Neurosci, 2003. 4(9): p. 703-13.
- Carpenter, A.E., et al., CellProfiler: image analysis software for identifying and quantifying cell phenotypes. Genome Biol, 2006. 7(10): p. R100.
- Wu, C.C., et al., High-throughput morphometric analysis of individual neurons. Cereb Cortex, 2004. 14(5): p. 543-54.
- Richards, G.R., et al., A morphology- and kinetics-based cascade for human neural cell high content screening. Assay Drug Dev Technol, 2006. 4(2): p. 143-52.
- Stewart, W., et al. High Content Identification of Neurotrophic Compounds Using Primary Rat Cortical in Society for Biomolecular Sciences. 2006. Seattle, WA.


