Effect of moisture variation on the robustness of NIR spectroscopy-based calibration models
Posted: 18 February 2021 | Derya Cebeci | No comments yet
NIR spectroscopy is well-known for its sensitivity to water, which can be useful for detecting water variation in the sample matrix. However, for many other applications, water intake of the samples may be an issue and must be closely monitored to gauge the predictive performance of calibration models. This article looks at how moisture fluctuations in drug products affect the performance of classification models. To achieve this, we built hit quality index (HQI) and principal component analysis (PCA) identification models on pharmaceutical finished products to see how humidity variations affect the robustness of these models.

While near-infrared spectroscopy (NIRS) is a highly valued tool with many applications in industry due to its fast and noninvasive nature, a significant drawback is its extreme susceptibility to humidity changes in the environment. In this study, we evaluate the influence of humidity variation on the predictive performance of NIR‑based multivariate calibration models. 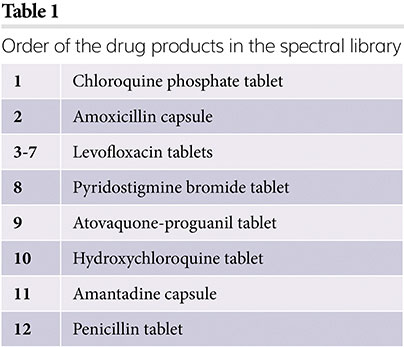
The pros and cons of the most common algorithms used in NIR or Raman spectroscopy systems in the market have been discussed in open literature.1 Here, spectral correlation technique, more specifically hit quality index (HQI) algorithm, and also principal component analysis (PCA) will be evaluated to see how their predictive performance are affected by the change in moisture content of the samples.
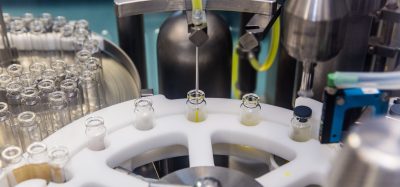
All drug products in this study were purchased from a licensed pharmacy. All samples in tablet and capsule forms were measured in diffuse reflectance with an average of 32 scans over the wavelength range of 1,600-2,400nm. These measurements are used as a spectral library and training sets in HQI and PCA models, respectively.
Moisture effect on HQI model
HQI, which is derived from cosine similarity of spectral vectors, is a common method for library matching of unknown materials. It individually compares the shape of the unknown test spectrum with all the spectra in the library and computes a degree of similarity index, ranging from zero to one (Equation 1). High values represent a measure of high similarity between the unknown and a library match.
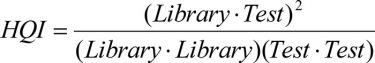
Equation 1
The effect of humidity on HQI identification models was investigated here. A mini-spectral library of 12 drug products were created and these are listed in Table 1. All measurements for the spectral library were taken as soon as the products were removed from their packaging, ensuring they were not exposed to humidity. After the library measurements were taken in the month of May, the samples were kept in well plates with the lid on in room conditions for a further six months.
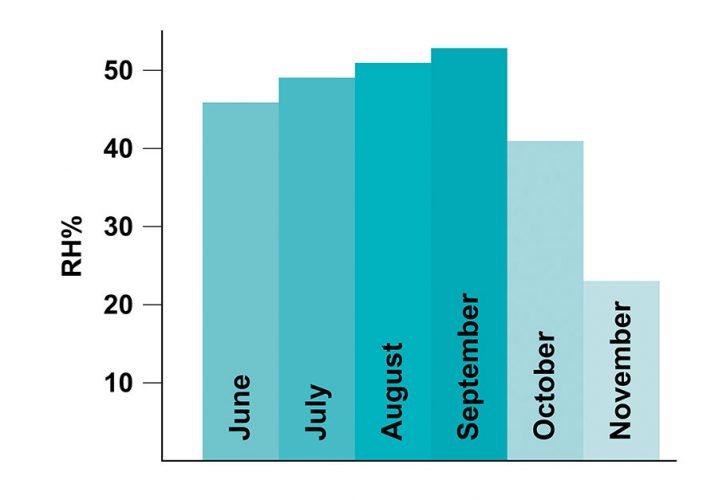
Figure 1: Average relative humidity (RH %) change of the room from June to November. Humidity levels show a decrease in the months of October and November as the heat was turned on in the room.
Periodic measurements on these samples over this time were conducted as part of validation studies to evaluate the predictive performance of the HQI model.
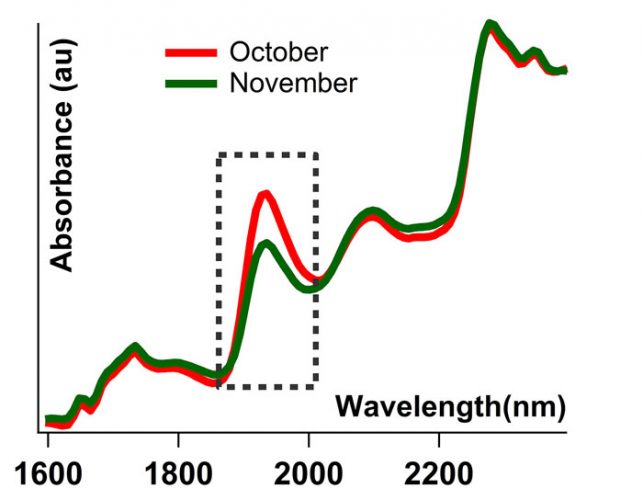
Figure 2: Spectra of the same levofloxacin tablet taken in October and November. Tablet was first removed from its packaging in May and left exposed to room conditions. Both spectra are SNV-normalised.
All tests carried out over the five‑month period correctly identified all products with an HQI threshold value of 0.90. Some samples, however, started failing in the sixth month’s run (see blue line in Figure 3). During this six-month period, although the samples were kept closed, they were still exposed to the atmosphere to some degree. The change in the spectral signature of a levofloxacin tablet over the course of a month, for example, can be seen in Figure 2. The region corresponding to water peak in the dotted box in Figure 2 shows the moisture variance between October and November, where the heat in the room was turned on in November and humidity levels decreased (Figure 1). The blue curve in Figure 3 represents the HQI values computed from the spectra collected from the samples that were exposed to the atmosphere for six months.
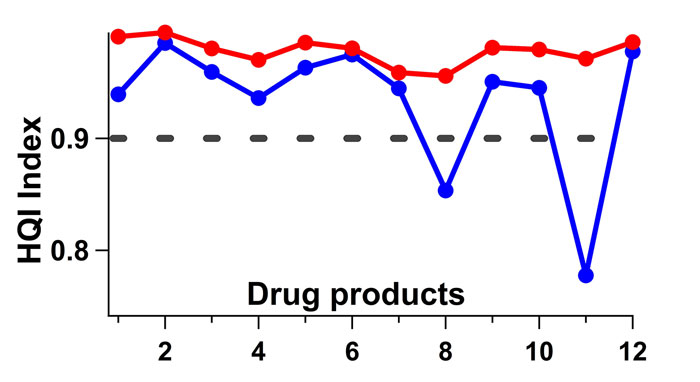
Figure 3: HQI index values of validation tests against the spectral library. Blue line is where the tablets are left in a well plate with the cover on for about six months and tested. Red line is when the water region (shown in the dotted box in Figure 2) is removed from the spectra and HQI values are recalculated. Clear improvement is observed in HQI values going up. Threshold (black dashed line) is set at 0.90.
The red line is constructed by eliminating the water region between 1,850-2,050nm in these same spectra. Without the water region the model prediction improves. Figure 3 also indicates that samples are differently affected by humidity in room conditions. Furthermore, the HQI model is found to be quite robust to minor spectral changes caused by room conditions. Only two samples out of 12 are identified incorrectly after a six-month exposure in room conditions.
Moisture effect on the PCA model
Both spectral correlation and factor-based multivariate approaches have their advantages and disadvantages. While the HQI method has the advantage of being simple and allows for rapid screening of materials against a verified spectral library, it is not particularly sensitive to small spectral changes. As a result, if the information sought lies in subtle variances between samples then multivariate techniques, such as PCA, may be more appropriate. PCA has the added advantage of being able to discriminate between samples with close formulations. For example, with the HQI model we were not able to precisely differentiate between the levofloxacin tablets based on their formulations or suppliers. PCA, on the other hand, produced a model with clear grouping of each formulation, as can be seen in Figure 4.
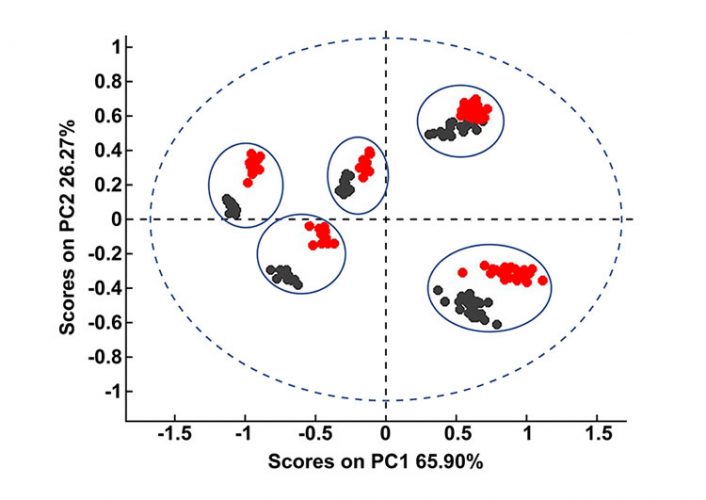
Figure 4: PCA plot of levofloxacin tablets with five different formulations. Black scores represent the samples that the calibration model is built on. After the same samples were exposed to the atmosphere for a week, their spectra were recollected and projected onto the PCA plot (red scores).
PCA is an unsupervised technique that assesses the variances in the training set of spectra and then ranks these variances as factors, assigning each spectrum a score value on each factor calculated by the algorithm. Details of PCA are thoroughly documented in literature.2 Previous studies have shown that factor-based models are highly sensitive to variances – an important one being humidity fluctuations.3 We demonstrated this effect in Figure 4 with levofloxacin tablets from five different suppliers. The PCA model in Figure 4 was constructed on the samples that were measured immediately after they were out of their pack. The model illustrates that there are five distinct clusters formed for the five formulations. Black scores in the figure represent the calibration samples. The same samples were then exposed to the atmosphere for a week and their spectra were recollected and projected onto the PCA plot (red scores).
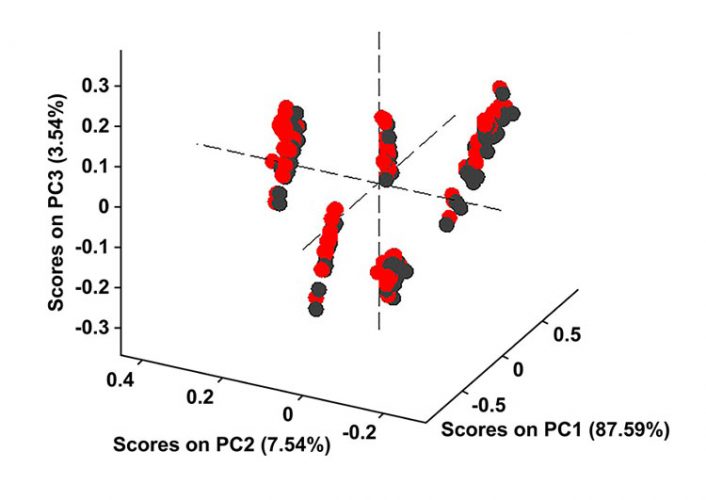
Figure 5: The water region of 1,850-2,050nm is removed from both calibration samples and the test samples used in Figure 4 and then the PCA model is reconstructed. Black scores are for the calibration set, while red scores represent the test samples projected on the PCA model. Without the water region the model prediction improves.
Figure 4 shows that the model fails to predict these exposed samples correctly; however, when the water region between 1,850 and 2,050 is eliminated from both calibration and test samples, the model predicts correctly (Figure 5). All test samples are correctly grouped in their respective formulation classes in Figure 5. Thus, we could say that although HQI models are more robust against variations in moisture content and small traces of water did not fail the HQI model, the robustness of NIR-based PCA models is strongly influenced by humidity.
Concluding remarks
Our periodic tests over the course of several months concluded that small changes in spectra due to humidity could be tolerated; however, too great a change in spectral signatures over time fails the HQI model. In addition, we found that PCA models are far more sensitive to changes caused by humidity. A one-week exposure to the atmosphere would fail the model (Figure 4). Therefore, all products should be measured as soon as they are removed from their packs to minimise the effect of atmospheric humidity. Another alternative may be to remove water region from the spectra before building the calibration models to limit the effect of moisture variation on the accuracy of model predictions.
Derya Cebeci
Derya currently works at PortMera Corp (Technopark Istanbul) as a Research Chemist, developing PAT tools as real-time chemical measurement systems and at-field screening applications. She has a PhD in Analytical Chemistry from Purdue University and holds an MBA degree from Ball State University. Prior to joining PortMera, she worked at the US Food and Drug Administration (FDA) as a postdoctoral fellow, generating spectroscopy methods for at-field counterfeit drug screening applications.
References
1. Bakeev KA, Chimenti RV. Pros and cons of using correlation versus multivariate algorithms for material identification via handheld spectroscopy. European Pharmaceutical Review. 2013.
2. Smith LI. A tutorial on Principal Component Analysis. 2002.
3. Yoon WL, Jee RD, Charvill A, Lee G, Moffat AC. Application of near-infrared spectroscopy to the determination of the sites of manufacture of proprietary products. Journal of Pharmaceutical and Biomedical Analysis. 2004;34(5):933-44.
Issue
Related topics
Analytical techniques, Near Infrared Spectroscopy (NIR), QA/QC, Spectroscopy