Raman spectroscopic techniques for biotechnology and bioprocessing
Posted: 7 February 2009 | Victoria Brewster, PhD Student, University of Manchester; Roger Jarvis, Research Assistant, University of Manchester and Royston Goodacre, Professor of Biological Chemistry, University of Manchester | No comments yet
Biotechnological expertise is becoming increasingly important within the pharmaceutical industry, and will play a pivotal role in the monitoring of fermentations, particularly their optimisation within the framework of Process Analytical Technologies (PAT). The ability to harness biological processes for the development of drug therapies, so called ‘biopharmaceuticals’ provides treatments that range from small molecule antibiotics to large recombinant proteins. Typically, synthesis of these drug products is enabled through the exploitation of bacterial, yeast, mammalian or plant cells. One of the earliest examples of protein biopharmaceuticals was the use of recombinant DNA technology to modify ‘Escherichia coli’ for the production of Human Insulin, which was followed by the development of Human Growth Hormone and Human Blood Clotting Factor1.
Biotechnological expertise is becoming increasingly important within the pharmaceutical industry, and will play a pivotal role in the monitoring of fermentations, particularly their optimisation within the framework of Process Analytical Technologies (PAT). The ability to harness biological processes for the development of drug therapies, so called ‘biopharmaceuticals’ provides treatments that range from small molecule antibiotics to large recombinant proteins. Typically, synthesis of these drug products is enabled through the exploitation of bacterial, yeast, mammalian or plant cells. One of the earliest examples of protein biopharmaceuticals was the use of recombinant DNA technology to modify ‘Escherichia coli’ for the production of Human Insulin, which was followed by the development of Human Growth Hormone and Human Blood Clotting Factor1.
Biotechnological expertise is becoming increasingly important within the pharmaceutical industry, and will play a pivotal role in the monitoring of fermentations, particularly their optimisation within the framework of Process Analytical Technologies (PAT). The ability to harness biological processes for the development of drug therapies, so called ‘biopharmaceuticals’ provides treatments that range from small molecule antibiotics to large recombinant proteins. Typically, synthesis of these drug products is enabled through the exploitation of bacterial, yeast, mammalian or plant cells. One of the earliest examples of protein biopharmaceuticals was the use of recombinant DNA technology to modify ‘Escherichia coli’ for the production of Human Insulin, which was followed by the development of Human Growth Hormone and Human Blood Clotting Factor1.
More recently, liberalisation of the legislation controlling the development of stem cell technologies, allows for further opportunities in the development of biopharmaceuticals. In support of all these efforts, there is a pressing need to develop rapid and accurate methods for bioprocess monitoring, both for product yield optimisation and quality assurance purposes. Often these methods utilise analytical techniques, such as vibrational spectroscopy to obtain broad chemical profiles of the reaction or biotransformation in real-time, ultimately on-line. These data are ‘holistic’ in nature (since many functional groups are measured) and can be interpreted using multivariate pattern recognition methods in a variety of ways, and a common theme is the calibration of spectral data to product concentration, usually employing the partial least squares regression algorithm2,3. Although these methodologies are well developed within the traditional chemical and pharmaceutical industries, the additional challenges of dealing with living processes have generated a great deal of interest in the evolution of PAT for biopharmaceuticals.
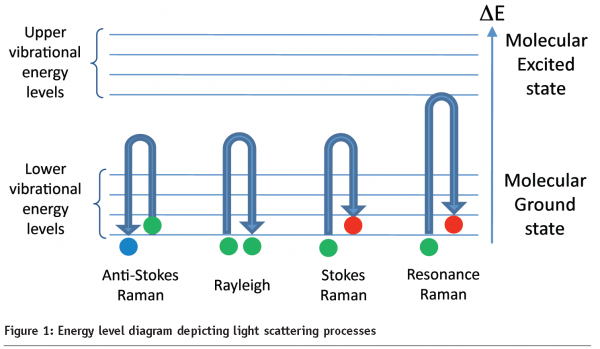
In this article we will discuss a particular vibrational spectroscopic technique called Raman spectroscopy, which involves measuring light that is inelastically scattered from a sample upon illumination with an intense monochromatic source. In Raman experiments, the analyte is illuminated with radiation typically from a laser (in the UV, visible or near-IR regions of the electromagnetic spectrum); the interaction of photons from this light source with molecules in the sample induces a series of molecular vibrations. As depicted in Figure 1, there are several possible scenarios, where photons will be either Rayleigh (elastically) scattered or Raman (in-elastically) scattered. The resultant Raman spectrum is a measure of how much energy a photon has lost (Stokes Raman scattering) or gained (anti-Stokes Raman Scattering). This value is expressed as the difference in energy between the incident and scattered light in units of cm-1(the reciprocal wavelength), and is generally described as the Raman shift. Stokes Raman scattering is most often recorded, since a majority of molecules will have an energy in the lowest vibrational level of the molecular ground state (~90%), so the probability of a Stokes event is much greater than anti-Stokes Raman scattering.
Raman scattering intensities are however typically weak, with approximately only 1 in every 106 – 108 photons being inelastically scattered. Fortunately, there are a number of ways to enhance the Raman signal; two common phenomena exploited to boost scattering intensities are resonance Raman (RR) spectroscopy and surface-enhanced Raman scattering (SERS). In RR spectroscopy the sample is excited with a frequency of light which is within the molecular absorption bands of a chromophore within the sample (see Figure 1). This excitation is in resonance with the electronic transitions, allowing the Raman scattering to be enhanced by a factor of 103 – 105 over conventional Raman scattering. At deep ultraviolet wavelengths (180 – 260 nm) RR measurements are particularly useful for obtaining quantitative data from biologically interesting species, such as amino acids, proteins, nucleic acids, RNA and DNA4, with the added advantage that in this UV range one is not plagued by fluorescence.


SERS relies on the analyte being in close proximity to, or adsorbed onto, a roughened metal surface or a colloidal solution, usually silver or gold; although other metals can be used, viz. copper, platinum and palladium. The interaction of the electric field of the incident light with the metal gives rise to a surface plasmon (an oscillating electric field) which is believed to enable an electromagnetic enhancement effect (via surface-plasmon polariton resonances), for analytes adsorbed or in close proximity to the metal surface. Additional signal enhancement is also thought to arise from a chemical or charge transfer effect often associated with adsorption of the analyte onto the metal surface. The overall Raman signal enhancement can be as much as 108 over conventional Raman scattering, and even higher (1014) since single molecule spectra can be readily acquired5. In addition, further enhancement can be achieved through a combination of the RR effect with SERS, known as surface-enhanced resonance Raman scattering (SERRS)6, which makes use of reporter dye molecules to tune into SERRS at specific incident wavelengths. SERRS has been shown to be more sensitive than fluorescence for the detection of DNA7 and can be readily multiplexed when combined with machine learning8.
Raman spectroscopy is a particularly suitable method for on-line analyses of bioprocesses, since it is non-destructive, inexpensive, rapid and quantitative. Moreover, the confocal nature of the technique means that one can focus through a window in a fermentor, thus obviating the need for additional probes into the bioreactor. The method provides a unique spectral fingerprint of the sample under analysis and is capable of detecting a broad range of analytes. The utility of Raman spectroscopic instrumentation is greatly increased by the ability to interface to microscopes for trace analysis, fibre optic probes for in situ identification and also to other types of analytical instrumentation including liquid chromatography columns for sample clean up. The versatility of Raman spectroscopy is also increased by the lack of sample preparation required and the ability to profile samples through a variety of transparent materials. Unlike infrared spectroscopy, Raman provides the capability to analyse compounds in aqueous solution with minimal interference from water absorption, which is a critical factor when considering biological applications. Instrumentation available for Raman analysis has progressed to a stage beyond the standard benchtop spectrometers of the past. Small versatile Raman probes are available commercially for in situ analysis ranging from hand held instruments to remote, high throughput systems attached to fibre optic probes, ideal for on-line reaction monitoring. At the other end of the scale sophisticated Raman microscopes with rapid mapping capabilities are being developed, allowing for spatially resolved mapping of a 1cm2 area in as little as four minutes (averaging 4000 spectra/min). The combination of all of the above properties, makes Raman spectroscopy a very promising technique for analysis of biopharmaceuticals and the rapid monitoring of complex bioprocesses.
Raman spectroscopy has been applied widely to study protein conformation both in solution9 and in solid states10. It is particularly good for inferring structural information from proteins with little secondary order structure, where conventional methods such as X-ray crystallography and circular dichroism would not be that informative. Many such studies of protein conformation take advantage of the sensitivity of the amide I band to conformational alterations. This approach has been used to study conformational changes of horse myoglobin and apomyoglobin after acid denaturation11,12, and also of Tumour Necrosis Factor (TNF) receptor in solution13, using both conventional Raman and UV resonance Raman spectroscopy. Other examples include the study of fibrillation in globular proteins, specifically the insulin fibrillation mechanism14. Raman spectroscopic analysis of insulin has also been able to provide information on protein aggregation, showing the transition of the native α-helical structure of insulin into β-sheets by reduction of the disulfide bonds15. Both Raman spectroscopy and UV resonance Raman have been used to characterise the side chains of pharmaceutical protein molecules. An excellent example of this is the work carried out by Wen et al. where Raman techniques were used to study the cysteine side chains of recombinant human interleukin-1 receptor antagonist (rhIL-1ra). In this case the Raman spectra were able to show that rhIL-1ra has four cysteine side chains all in a free sulfhydryl state16. In this study the authors also investigated Raman optical activity, which measures the stereochemistry of chiral molecules; in this case amino acids within the protein.
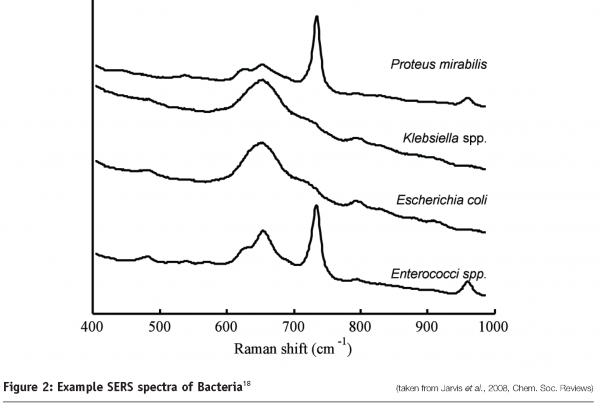
Along with the identification of protein pharmaceuticals, Raman techniques have been utilised for the identification of microorganisms (see Figure 2). SERS spectra of bacteria have shown sufficient detail and reproducibility to distinguish not only between different species but different strains within a species17,18. The enhancement achieved by using SERS means that it is possible to identify single bacterial cells using Raman spectroscopy.


Advances in spectroscopic instrumentation and data analysis techniques have facilitated the application of Raman spectroscopy to monitor complex bioprocesses. One of the first examples of this was in the on-line monitoring of the biotransformation by yeast of glucose to ethanol, allowing accurate predictions to be made of glucose and ethanol concentrations simultaneously in fermentation processes without recourse to time consuming chromatography2. Following this a range of fermentation broths containing the fungus Gibberella fujikuroi producing gibberellic acid were studied and Raman spectroscopy was able to monitor accurately the progress of the fermentation3. SERS has also proved to be extremely effective for the off-line monitoring of bioprocesses, enabling the quantification of secondary metabolites present in microbial fermentations19.
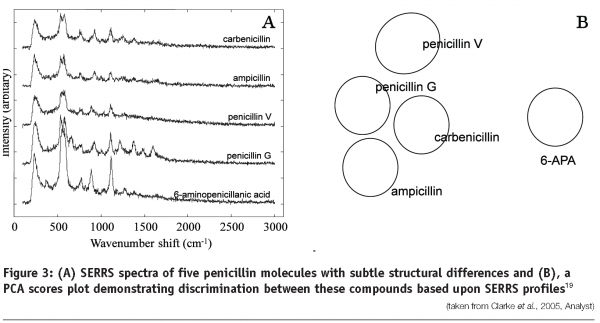
Raman technologies have been applied to the identification and monitoring of small biological pharmaceuticals, including antibiotics19. Raman spectroscopy and SERS have been used in conjunction with multivariate data analysis to differentiate between five different penicillins (Figure 3) and quantify the concentration of penicillin in solution and in fermentation broths19. In addition UV resonance Raman spectroscopy has been used to monitor the mode-of-action of the antibiotic amikacin. UVRR spectra analysed using partial least squares regression and 2D correlation analysis were able to predict the level of this antibiotic in Pseudomonas aeruginosa bacterial cells. The data also provided chemical information demonstrating that the observed spectral changes correlated with the known mode-of-action of the antibiotic20.


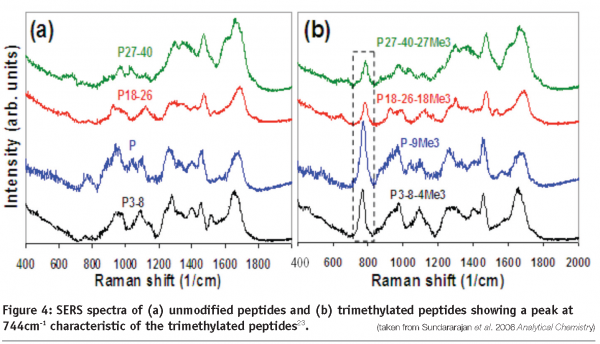
An important area in biopharmaceutical characterisation is the identification of post-translational modifications, and of particular significance are glycosylation and phosphorylation. These modifications may affect the stability, efficiency, immunogenicity and pharmokinetics of a protein therapeutic. For example in the Human Immunoglobulin G antibody, changes in efficiency have been directly related to the glycosylation status. Therefore, methods that provide the capability for detection and determination of post-translational changes allow for fermentation or purification procedures to be optimised towards the desired end product. For example, Raman spectroscopy has been used in this area to successfully quantify the level of phosphorylation in the protein casein, and also determine the structural changes which occur during dephosphorylation21. Raman microscopy has also been used in conjunction with computer modelling methods to determine the glycosylation status of the enzyme fungal beta-N-acetylhexosaminidase22. Finally, SERS has been developed for the detection of a variety of post-translational modifications, including acetylation, methylation and ubiquitination (see Figure 4)23.


Outlook
The future for Raman spectroscopy in the biopharmaceutical arena looks promising. The ability of the laser source to penetrate glass means that measurements can be taken through windows in reaction vessels. This eliminates the need to remove samples from reactions or introduce probes for analysis offering a distinct advantage to the biopharmaceutical market in terms of analytical throughput and maintaining a sterile environment. The increased sensitivity of Raman techniques coupled with advanced numerical analysis methods make the on-line identification of pharmaceutical molecules, monitoring of fermentation processes and quantification of post-translational modifications a realistic goal for the future.
Acknowledgements
We would like to thank the BBSRC for funding.
References
- Goddard, P. (1991) Therapeutic proteins-a pharmaceutical perspective, Advanced drug delivery reviews, 6, 28-103.
- Shaw, A.D, Kaderbhai, N, Jones, A, Woodward, A.M, Goodacre, R, Rowland, J.J, Kell, D.B. Noninvasive, on-line monitoring of the biotransformation by yeast of glucose to ethanol using dispersive Raman spectroscopy and chemometrics. Applied Spectroscopy, 53, 1419-1428
- McGovern, A.C, Broadhurst, D, Taylor , J, Kaderbhai, N, Winson, M.K, Small, D.A, Rowland, J.J, Kell, D.B, Goodacre, R (2002) Monitoring of complex industrial bioprocesses for metabolite concentrations using modern spectroscopies and machine learning: application to gibberellic acid production. Biotechnology and Bioengineering, 78, 527-538
- Spiro, T. G. (1974) Resonance Raman spectroscopy: a new structural probe for biological chromophores. Accounts of Chemical Research 7: 339-344.
- Nie, S. and S. R. Emory (1997) Probing single molecules and single nanoparticles by surface-enhanced Raman scattering. Science 275(5303): 1102-1106.
- Graham, D, Mallinder, B.J, Whitcombe, D, Watson, N.D, Smith, W.E.(2002). Simple multiplex genotyping by surface-enhanced resonance Raman scattering. Analytical Chemistry 74: 1069-1074.
- Graham D. and Faulds K (2008). Quantitative SERRS for DNA sequence analysis, Chemical Society Reviews, 37, 1042-1051.
- Faulds, K, Jarvis, R.M, Smith, W.E, Graham, D, Goodacre, R. (2008) Multiplexed detection of labelled oligonucleotides using serface enhanced resonance Raman scattering (SERRS). Analyst, 133, 1505-1512.
- Tuma, R. (2005) Raman spectroscopy of proteins; from peptides to large ensambles. Journal of Raman Spectroscopy, 36, 307-319.
- Sane, S.U, Wong, R, Hsu, C.C. (2004) Raman spectroscopic characterisation of drying-induced structural changes in a therapeutic antibody: correlating structural changes with long term stability. Journal of Pharmaceutical Science, 93, 1005-1018.
- Chi, Z.H, Asher, S.A. (1998) UV Raman determination of protein acid denaturation: selective unfolding of helical segments of horse myoglobin. Biochemistry, 37, 2865-2872.
- Chi, Z.H, Asher, S.A. (1999) Ultraviolet resonance Raman examination of horse apomyoglobin acid unfolding intermediates. Biochemistry, 38, 8196-8203.
- Tuma, R, Russell, M, Rosendahl, M, Thomas, G.J. (1995) Solution conformation of the extracellular domain of the human tumour necrosis factor receptor probed by Raman and UV resonance Raman Spectroscopy. Biochemistry, 34, 15150-15156.
- Huang, K, Maiti, N.C, Phillips N.B, Carey, P.R, Weiss M.A. (2006) Structure –specific effects of protein topology on cross-β assembly: studies on insulin fibrillation. Biochemistry, 45, 10278-10293.
- Zheng, R, Zheng, X.J, Dong, J, Carey, P.R. (2004) Proteins can convert to β-sheet in single crystals. Protein Science, 13, 1288-1294.
- Wen, Z.Q, Cao, X.C, Vance, A. (2008) Conformation and side chain environment of recombinant human interleukin-1 receptor antagonist (rhIL-1ra) probed by Raman spectroscopy, Raman optical activity and UV resonance Raman spectroscopy. Journal of Pharmaceutical Sciences, 6, 2228-2241.
- Jarvis, R.M. Goodacre, R. (2004) Rapid discrimination of bacteria using surface enhanced Raman spectroscopy. Analytical Chemistry, 76, 40-47.
- Jarvis, R.M, Goodacre, R. (2008) Characterisation and identification of bacteria using SERS, Chemical Society Reviews, 31, 931-936.
- Clarke, S.J, Littleford, R.E, Smith, W.E, Goodacre, R. (2005) Rapid monitoring of antibiotics using Raman and surface enhanced Raman spectroscopy. Analyst, 130, 1019-1026.
- López-Diez, E.C, Winder, C.L, Ashton, L, Currie, F, Goodacre, R. (2005) Monitoring the mode of action of antibiotics using Raman spectroscopy: investigating sub-inhibitory effects of amikacin on Pseudomonas aeruginosa. Analytical Chemistry, 77, 2901-2906
- Jarvis, R.M, Blanch, E.W, Golovanov, A.C, Screen, J, Goodacre, R. (2007), Quantification of casein phosphorylation with conformational interpretation using Raman spectroscopy. The Analyst,132, 1053-1060.
- Ettrich, R, Kopecky, V, Hofbauerova, K, Baumruk, V, Novak, P, Pompach, P, Man, P, Plihal, O, Kuty, M, Kulik, N, Sklenar, J, Ryslava, H, Kren, V, Bezouska, K. (2007) Structure of the dimeric N-glycosylated form of fungal beta-N-acetylhexosaminidase revealed by computer modelling, vibrational spectroscopy, and biochemical studies. BMC Structural Biology, 32, 1471-1478
- Sundararajan, N, Mao, D, Chan, S, Woong Koo, T. (2006) Ultra sensitive detection of post translational modifications using surface enhanced Raman spectroscopy. Analytical Chemistry, 78, 3543-3550.


