Why is thermal analysis important to the industry?
Posted: 11 November 2005 | | No comments yet
Thermal analysis equipment can be found in nearly all of the analytical, development, formulation and QA laboratories within the pharmaceutical industry. However, these work horse instruments are learning to run faster and to analyse an ever more varied field of samples.
Thermal analysis equipment can be found in nearly all of the analytical, development, formulation and QA laboratories within the pharmaceutical industry. However, these work horse instruments are learning to run faster and to analyse an ever more varied field of samples.
Thermal analysis equipment can be found in nearly all of the analytical, development, formulation and QA laboratories within the pharmaceutical industry. However, these work horse instruments are learning to run faster and to analyse an ever more varied field of samples.
The physical form of an active pharmaceutical ingredient (API) must be fully characterised before patient filing and submission to regulatory authorities1. Simply heating a solid API from the ambient storage temperature and recording the phase transitions of the material is an essential first step in judging the stability of the form that has been isolated. This type of experiment will indicate whether the API has potentially more than one polymorphic or hydrate form; will show if the material is chemically stable at elevated temperatures and is likely to indicate the presence of any amorphous content produced by milling and grinding that has been applied to achieve an appropriate particle size and size distribution. Further, if the physical form of the material is then monitored at a controlled temperature for a period of time, the long term stability of the API may also be recorded1. Unknown or uncontrolled changes in the form of an API, e.g. polymorphic conversion or re-crystallisation of amorphous domains, will alter the bioavailability of the API and may also allow competitors to challenge the patients associated with the material. Thermal analysis, as it typically records a physical property as a function of temperature and time, is an ideal method for recording the phase behaviour and stability of an API2,3.
Thermal analysis experiments are relatively easy to perform: heat capacity, mass, or any other pertinent property is measured with respect to temperature. The temperature associated with the experiment can be held constant or varied in a controlled manner. Therefore, the output from a typical piece of thermal analysis is a matrix containing time, temperature and the magnitude of the recorded property. Such a simple approach allows the generation of a plethora of articles and research papers. For example, a basic search on Google Scholar yields 22400 articles that contain the term ’thermal analysis‘ in the published title, whereas there are 36500 articles that contain the term ’high performance liquid chromatography‘ within the title, (both searches were from 2000 to the present). Thus, in terms of research publications, thermal analysis is a key tool in the discovery of new knowledge and is comparable in importance to high performance liquid chromatography, HPLC.
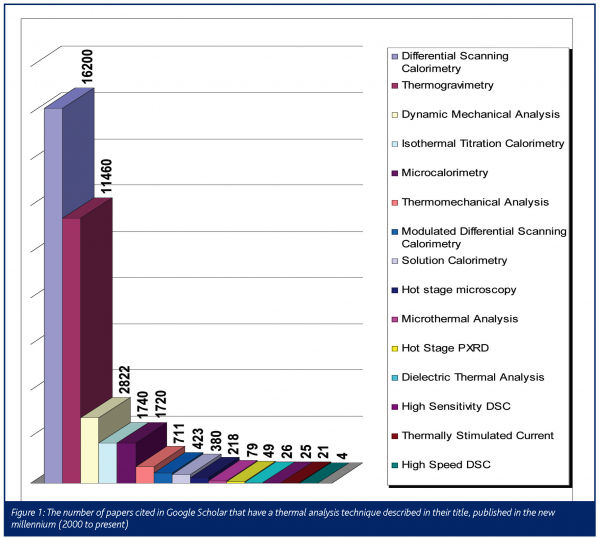
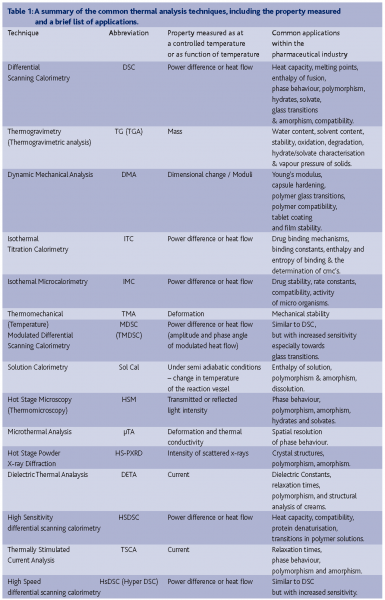
Thermal analysis includes a broad range of techniques. In fact, any measurement where the temperature is controlled and recorded with respect to time may loosely be defined as thermal analysis. An attempt to list all of the thermal analysis techniques available is therefore quite difficult owing to the large number of techniques which qualify under the broad definition of thermal analysis. Table 1 is an attempt to collate and define the current techniques which are commonly referred to as being part of thermal analysis. The reader should note that this list is not exhaustive, but simply expresses the authors’ opinion of the current state of the field. The number of papers published in the last five years associated with each of the techniques is shown in Figure 1. This brief study was biased towards the name selected for the search, so the numbers of papers should be used as a guide to describe trends in publishing, rather than an indication of exact totals. However, Figure 1 does show that differential scanning calorimetry and thermogravimetry are the mainstay of analytical research associated with thermal analysis. Thus this article will deal in depth with the developments associated with these two techniques.
Differential scanning calorimetry – a review and what’s new
Differential scanning calorimetry DSC is the most popular form of thermal analysis (Figure 1) and has been routinely applied in the pharmaceutical sciences since the 1970s1. DSC is used to measure the heat flow in and out of both a sample and reference crucible during a controlled temperature programme. The sample crucible usually contains the API or material under study and the reference crucible is either left empty or is loaded with an inert reference material relevant to the sample under investigation. The crucibles are usually aluminium pans and contain 1 to 10mg of sample. Two general types of DSC are available that measure heat flow in slightly different ways; power compensated and heat flux DSC. Both types of DSC apply the temperature programme via heaters using a furnace type arrangement. The temperature programme is commonly linear heating at a rate of 10°C/min. Heat flux DSC comprises a single heating block with thermocouples used to monitor the temperatures of both the sample and reference crucibles. The temperature differential between the sample and reference is used to determine the heat flow associated with transitions and reactions within the sample crucible as a function of the temperature programme. Power compensated DSC places the reference and sample crucibles in two separate furnaces. The temperature of the sample and reference is monitored again by thermocouples and heat flow is adjusted between the sample and reference furnaces by use of separate heaters to maintain the same temperature in both crucibles. In such a way the difference in heat flow or power between the two crucibles is compensated and a direct measure of the heat flow from the sample as a function of the programmed temperature is recorded. There are a number of reviews and books that describe the theoretical and experimental aspects of DSC in greater depth2,3,4.
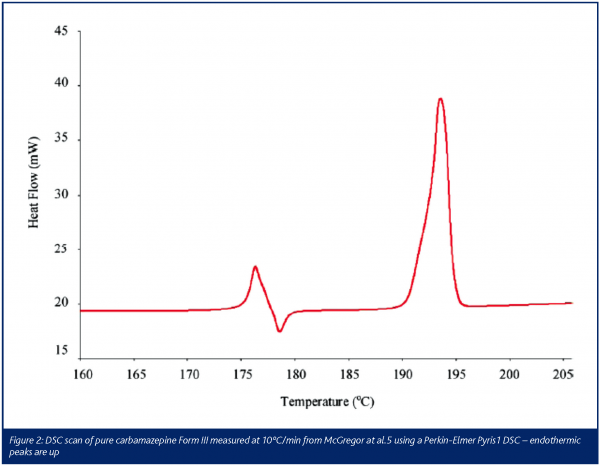
A typical application of DSC is shown in Figure 2, an investigation of the polymorphs of the antiepileptic carbamazepine carried out by McGregor et al.5. Polymorphism is the ability of an organic molecule to exist in more than one distinct crystal form5. Carbamazepine has several crystal forms5. Heating form III (Figure 2) produces three clear transitions; two endothermic peaks and an exothermic peak. When a crystalline material melts, energy is required to disrupt the lattice interactions that hold the crystal together. The first peak beginning at approximately 175ºC in Figure 2 illustrates this process, as heat flow into the sample is required to melt form III, this is observed as an endothermic peak. However, as the temperature of the sample is raised above 175ºC and once in the molten state, carbamazepine re-crystallises into a more stable form. Re-crystallisation produces heat as non-covalent bonds are being formed in the new crystalline structure, so this is observed as an exothermic peak immediately after the initial melting peak of form III. Upon heating the sample still further, a second endothermic melting peak is seen, which corresponds to the melting point of form I. The pattern of peaks shown in Figure 2 is typical for materials that exhibit polymorphism and so simple DSC experiments, as described here, contribute to the pre-formulation studies associated with the development of a new API. It is important to note that two types of polymorphism exist and in order to discuss this situation it is helpful to consider an API that has two polymorphic forms. When one of the two forms is more stable, irrespective of temperature, then the term monotropic is used. In the case of enantiotropic polymorphs the order of stability will depend on temperature, so form I may be the most stable at one particular storage temperature, but if the temperature is either raised or lowered by an appropriate amount, form II will become the most stable. Thus it is imperative to know which type of polymorphism is present when characterising an API. Giron describes how to modify a simple DSC protocol to determine which form of polymorphism is exhibited6. These experiments involve altering the heating and cooling rates of the DSC and investigating the change in the pattern of the melting and re-crystallisation peaks6. In this and many other pharmaceutical applications of DSC calibration and validation are extremely important, especially when working within GLP and GMP. Giron has listed the available certified substances and calibration protocols for DSC and new users of DSC should review this paper1.
There have been some major developments in DSC in recent years. The first was modulated DSC (MDSC) or temperature modulated DSC (TMDSC). Originally invented by Reading, and recently reviewed by Simon7, MDSC involves the imposition of a sinusoidal heating cycle on top of the standard linear programme. Typical experimental parameters are within the following ranges; underlying heating rate 1 to 5ºC/min, amplitude of temperature modulation 0.1 to 1ºC, frequency of temperature modulation 20 to 100 seconds. Thus the observed heat flow will also suffer modulation and, by the use of Fourier transformation analysis, this output signal can be resolved into non-reversing and reversing components, which reflect kinetically hindered events and the underlying reversible components, respectively8. The advantage of MDSC is the visualisation of overlapping thermal events, especially when a glass transition is obscured by enthalpy relaxation, water loss or the phase transitions of other components within the formulation7.
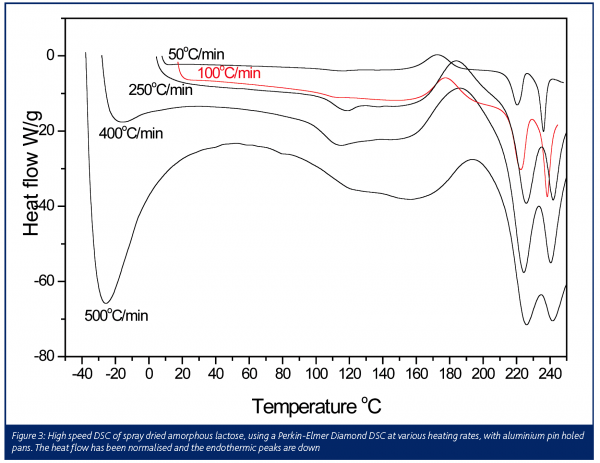
The second recent development has been high-speed DSC. After a little modification, either the manufacture of low mass furnaces9 or the introduction of extra thermocouples to improve base line stability10, modern DSCs may run with extremely high heating rates in the range 100 to 500ºC/min. Figure 3 clearly shows how the sensitivity towards the thermal transitions of amorphous spray dried lactose is increased at high heating rates. Beginning at low temperature, the first observation is the large ‘hook’ that increases in size and breadth as the heating rate is increased. This is an instrumental effect11, which can be compensated for by initiating the heating scan at lower temperatures far below the range of interest, providing the DSC has an adequate cooling facility. For all heating rates a glass transition was observed between 100 and 120ºC seen as the classic step change in the baseline. This is then followed by the re-crystallisation of the lactose simultaneously into both its a and β forms, which subsequently melt giving two endothermic peaks between 220 and 240ºC. The magnitude of all the transitions increase as a function of heating rate, but some resolution is lost. This is clearly observed in the melting peaks for the α and β forms of lactose. The output from a DSC is heat flow and is measured in W or J/s. Most thermally driven transitions will absorb or evolve the same total amount of heat (J) irrespective of the underlying heating rate. Thus, very simply, at faster heating rates the heat flow associated with the sample’s transitions will occur over a shorter period, thus the deflection in the heat flow or power scale will be greater, as the number of joules will be divided by a smaller number of seconds.
A major benefit of high-speed DSC is its greater sensitivity towards the glass transition – this is important for the detection of small amounts of amorphous content in otherwise crystalline powders. Milling and grinding crystalline samples often introduces regions of amorphous disorder that destabilise the whole powder, causing agglomeration and chemical degradation12. High speed DSC offers potentially lower limits of detection for amorphous material. Studies involving lactose have shown the limits of detection for amorphous content are in the 0.5 to 1% w/w range for high speed DSC, whereas the detection limit for conventional DSC is approximately 10% w/w9,12.
Thermogravimetry
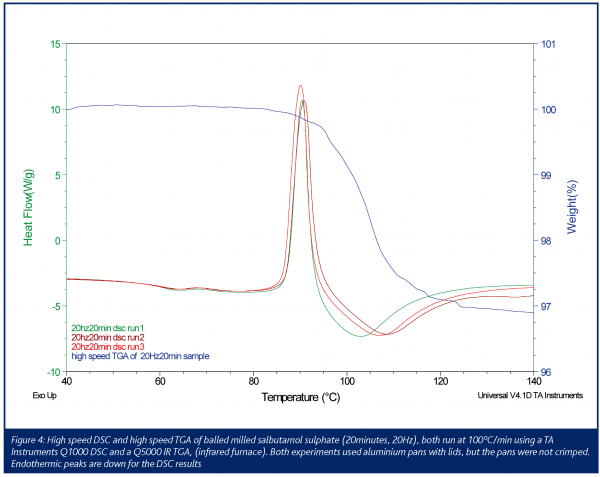
Thermogravimetry involves recording mass as a function of temperature. These experiments are carried out using modified balances that include a furnace which allows the control of a temperature programme with the simultaneous measurement of the mass of the sample under study1,3,4. Thermobalances or thermogravimetric analysers (TGAs) plot the percentage change of mass or its derivative as a function of temperature. Typical applications of thermogravimetry are the measurement of absorbed moisture and the characterisation of hydrates associated with APIs3. The loss of solvents other than water may also be measured and, in addition, the degradation of pharmaceuticals in various purge gas atmospheres may also be recorded as a function of time and temperature3. For the past decades this area of thermal analysis has remained largely static in terms of new developments, but equipment with radically redesigned balance furnaces is currently being introduced to the market. In these novel TGAs the sample is heated by an infrared furnace using four tubular quartz halogen lamps. The infrared radiation is focused onto a silicon carbide absorber which forms a sample enclosure. This arrangement provides a uniform temperature environment that may also control high linear heating rates up to 500ºC/min. Figure 4 shows a preliminary result using an infrared furnace to analyse a milled sample of salbutamol sulphate. From the high speed DSC data, a glass transition and an exothermic re-crystallisation peak indicate that the milling has introduced amorphous content into the crystalline powder. An endothermic peak directly after the re-crystallisation may have been caused by a melting endotherm or the loss of absorbed water from the sample. The blue line shows the percentage weight loss from the sample when heated at the same 100ºC/min rate used in the DSC experiments. It is clear that the approximate 3% weight loss from the sample is the cause of the endothermic peak and is likely to be the loss of absorbed water, expelled from the amorphous regions as they re-crystallize (control experiments of the non-milled crystalline material showed it to be essentially anhydrous). High speed DSC was applied in this example to improve sensitivity and thus allow the identification of a relatively small glass transition. However, running high speed thermogravimetry was essential for the interpretation of the results. High speed thermogravimetry has been available for only a matter of months so further research is required to fully develop the pharmaceutical applications of this emerging technique.
Summary
This article has dealt with two recent and major developments in the most popular forms of thermal analysis, namely high speed DSC and high speed thermogravimetry. Commercially, these advances will be extremely important to the pharmaceutical industry because they increase sensitivity and simultaneously dramatically decrease the length of time required to conduct experiments, which will provide a large economic benefit. For the developments associated with the other forms of thermal analysis and coupled thermal analysis techniques, Giron provides an excellent review1.





References
1. D. Giron, Applications of thermal analysis and coupled techniques in the pharmaceutical industry. (2002) J. Thermal Anal. 68, 335-357
2. S. D. Clas, C. R. Dalton, B. C. Hancock, Differential scanning calorimetry: applications in drug development. (1999) Pharm. Sci. Tech. Today 2, 311-319
3. J. L. Ford, P. Timmins, Pharmaceutical thermal analysis: Techniques and applications. (1989) Halsted Press, New York, NY, USA
4. P. J. Haines, Principles of thermal analysis and calorimetry. (2002) RSC Paperbacks, Royal Society of Chemistry, UK
5. C. McGregor, M. H. Saunders, G. Buckton, R. D. Saklatvala, The use of high-speed differential scanning calorimetry (Hyper-DSC™) to study the thermal properties of carbamazepine polymorphs. (2004) Thermochimica Acta 417, 231-237
6. D. Giron, Thermal analysis and calorimetric methods in the characterisation of polymorphs and solvates. (1995) Thermochimica Acta 248, 1-59
7. S. L. Simon, Temperature modulated differential scanning calorimetry: theory and application. (2001) Thermochimica Acta 374, 55-71
8. P. G. Royall, D. Q. M. Craig, C. Doherty, Characterisation of the glass transition of an amorphous drug using modulated DSC. (1998) Pharm. Res. 15, 1117-1121
9. P. Gabbott, P. Clarke, T. Mann, P. G. Royall, S. Shergill, A high-sensitivity, high-speed DSC Technique: Measurement of amorphous lactose. (2003) American Laboratory, August issue 17-22
9. S. Hussain, D. B. Grandy, M. Reading, D. Q. M. Craig, A study of phase separation in peptide-loaded HPMC films using Tzero-modulated temperature DSC, atomic force microscopy and scanning electron microscopy. (2004) J. Pharm. Sci. 93, 1672-1681
10. T. F. J. Pijpers, V. B. F. Mathot, B. Goderis, R. L. Scherrenberg, E. W. van der Vegte, High-speed calorimetry for the study of the kinetics of (de)vitrification, crystallisation, and melting of macromolecules. (2002) Macromolecules 35, 3601-3613
11. M. Saunders, K. Podluii, S. Sukhraj, G. Buckton, P. G. Royall, The potential of high speed DSC (Hyper-DSC™) for the detection and quantification of small amounts of amorphous content in predominantly crystalline samples. (2004) Int. J. Pharm. 274, 35-40


