Identifying human toxicity potential
Posted: 20 July 2006 | | No comments yet
The statins (3-hydroxy-3-methylglutaryl coenzyme A [HMG-CoA] reductase inhibitors) are drugs that inhibit cholesterol biosynthesis by blocking the formation of the cholesterol precursor mevalonate. Statins are the most effective cholesterol-lowering agents available and are considered the first line of treatment for most patients with high serum cholesterol levels1.
The statins (3-hydroxy-3-methylglutaryl coenzyme A [HMG-CoA] reductase inhibitors) are drugs that inhibit cholesterol biosynthesis by blocking the formation of the cholesterol precursor mevalonate. Statins are the most effective cholesterol-lowering agents available and are considered the first line of treatment for most patients with high serum cholesterol levels1.
The statins (3-hydroxy-3-methylglutaryl coenzyme A [HMG-CoA] reductase inhibitors) are drugs that inhibit cholesterol biosynthesis by blocking the formation of the cholesterol precursor mevalonate. Statins are the most effective cholesterol-lowering agents available and are considered the first line of treatment for most patients with high serum cholesterol levels1.
Besides lowering cholesterol levels, the statins exert multiple effects on cellular functions such as cell proliferation, differentiation and survival and regulation of cell shape and motility. Statins inhibit proliferation and induce apoptosis in a variety of cell lines, and they also show antitumour effects in animal tumour models, slowing cell growth and inhibiting the metastatic process2.
Although statins are well tolerated in general, due likely to these multiple effects on cell function, they can have undesirable side effects. Certain statins have been shown to cause toxicity, which for one statin was fatal1. Cerivastatin, one of the first marketed statins, was withdrawn in 2001 after the drug was associated with more than 100 deaths due to toxicity3.
The mechanism for statin-induced injury is still the subject of debate, but there seems to be a common pathway, which is consistent with apoptotic cell death. The apoptotic trigger has been attributed to various events, like the blocking of cholesterol biosynthesis4, the reduction in the levels of isoprenoids such as ubiquinone5 and most likely the reduction in mevalonate metabolites such as farnesol and geranylgeraniol6. These metabolites are involved in the prenylation and subsequent targeting and activation of regulatory proteins, which promote cell survival by inhibiting apoptosis.
High Content Screening (HCS) allows the measurement of multiple cellular end-points on a cell-by-cell basis. This is possible through the use of multi-colour probe fluorescence and quantitative microscopy linked to sophisticated image-analysis software. HCS was first introduced as a tool for early drug discovery7, and it also has potential applications in drug safety evaluation, making it a promising technology especially for early, medium-throughput safety assessments. In fact, multiprobe fluorescence has been used in the past to quantitate cellular toxicity8.
In this paper we demonstrate the use of an HCS cytotoxicity assay to identify human toxicity potential and, furthermore, the sequence of cellular events associated with the pathogenesis of the toxicity. This information could potentially be used to reduce human toxicity in drug treatment, or to optimise effectiveness for cancer therapy.
Materials and methods
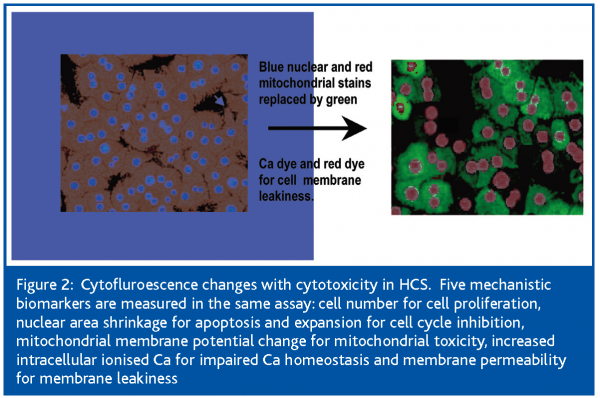
The current study was undertaken to define the cellular events leading to the cytotoxicity of the statins, using high content, live-cell, kinetic analysis. This was achieved with the use of the Cellomics Kinetic Scan Reader, an HCS platform equipped with a cell incubator that maintains the cells in physiologic conditions of temperature, CO2 and humidity to ensure cell health for the duration of the experiment (Figure 1). This analyser measures in the same assay 5 mechanistic parameters: cell number for cell proliferation; nuclear area decrease for apoptosis; mitochondrial membrane potential change for mitochondrial toxicity; increased intracellular ionised Ca for impaired Ca homeostasis and membrane permeability for membrane leakiness. These parameters change substantially with drug-induced toxicity (Figure 2).
Cell culture
HepG2 cells (passage 1-10) were grown in poly-D-lysine-coated flasks, using Gibco Modified Eagle Medium, supplemented with 10% FBS, 1% penicillin/streptomycin, 2mM L-glutamine and 1% of MEM non-essential amino acids. Cells were plated in Biocoat 96-well plates (BD Biocoat Poly-D-Lysine 96-well plates) at a density of 3,000 cells per well in 100-ul volume and they were allowed to attach overnight before treatment.
Drug treatment
Cerivastatin and pravastatin were supplied by Sequoia Research Products (Oxford, UK). Statin stocks were made in DMSO at 20 mM. Cells were treated with the corresponding dose of statin (0, 0.1, 0.2, 0.39, 0.78, 1.56, 3.32, 6.25, 12.5, 25, 50 and 100 uM) and the DMSO concentration was adjusted to 0.25% (except for the 100 uM dose, for which DMSO was 0.5%). For this, 50 ul of media were carefully removed from all wells and 100 ul of a mix containing 1.5-fold concentrated drug in DMSO was added to the wells.
Assay
Multiparametric live-cell kinetic assays were performed using a combination of spectrally compatible live-cell dyes. We used Hoechst 33342, a DNA-binding dye to measure nuclear size and for the cell counting; TMRM (tetramethylrhodamine-methyl ester), a Nerstian dye with potential-driven accumulation in the mitochondria, to measure mitochondrial membrane potential; Fluo-4 AM, a dye whose fluorescence increases dramatically upon calcium binding, to measure intracellular free calcium and TOTO-3, a dimeric cyanine nucleic acid-binding dye which does not penetrate intact cellular membranes, to measure cell membrane permeability.
To define the temporal sequence of cellular events and the earliest signs of toxicity, we looked at the effect of the cerivastatin after 12 and 72 hours of exposure and during 1 to 6, 8 to 13 and 16 to 24 hours of exposure.
Data acquisition
Cells were loaded for 1 hour at 37°C, using 50 ul of a 4-fold concentrated fluorophore cocktail to give a final concentration of 0.8 uM Hoechst 33342, 20 nM TMRM, 1 uM Fluo-4 AM ester and 1 uM TOTO-3. Immediately before reading the plates, 50 ul of 5XFCCP, 50 ul of 5-fold concentrated ionomycin and 50 ul of 5-fold concentrated tween-20 were added to 3 individual wells each as positive controls, giving a final concentration of 50 uM FCCP, 10 uM ionomycin and 0.25% Tween-20, respectively. After that the plates were immediately placed in the KSR incubation chamber that had been equilibrated for 15 minutes to 37°C and 5% CO2. The cells were allowed to adjust to the chamber environment for 10 minutes prior to the start of the scan. Plates were scanned using a Kinetic Scan® Reader (KSR) (Cellomics, Pittsburgh, PA) with a 20X objective. A 4-channel assay was developed using the compartmental analysis bioapplication. The fluorophores used were Hoechst 33342 (Molecular Probes, Eugene, OR) on channel 1, TMRM (Molecular Probes) on channel 2 or TRITC channel, Fluo-4 (Molecular Probes) in channel 3 or FITC channel and TOTO-3 (Molecular Probes) in channel 4 or Cy5 channel. The Hoechst-stained nucleus was used for object selection, with a minimum object area of 25 units and a maximum object area of 1,200 units, which ensures the exclusion of debris below the lower limit and cellular clumps above the upper limit of selection. The following assay parameters were used: Background Correction = 20, SpotKernelRadius = 15, RingDistanceCh2 = 2, RingWidthCh2 = 10, CircModifierCh3 = 8, CircModifierCh4 = 0, Object ID Method = Isodata Threshold for channel 1 and Fixed Threshold for channels 2, 3 and 4.
All channels were set to auto-exposure (the exposure time is selected based on the fluorescence of predetermined wells, and it is then set constant for the whole plate), except for channel 4, which was set to a fixed exposure of 1 second. The cells were monitored for 3 hours, during which 6 readings were performed 30 minutes apart. The cells were kept viable in an incubator with the appropriate conditions of temperature, CO2 and humidity during the duration of the scan.
Data analysis
The following features were used for data analysis: Feature_MEAN_ObjectSizeCh1 and Feature_SE_ObjectSizeCh1 for Hoechst, Feature_MEAN_RingSpotAvgIntenCh2 and Feature_SE_RingSpotAvgIntenCh2 for TMRM, Feature_MEAN_CircAvgIntenCh3 and Feature_SE_CircAvgIntenCh3 for Fluo-4, Feature_MEAN_CircAvgIntenCh4 and Feature_SE_CircAvgIntenCh4 for TOTO-3. Also, Feature_SelectedObjectCount was used for cell counts. The IC50s were calculated using GenStat software (VSN International Ltd., Herts, UK). For this, the levels in the untreated controls defined the minimum and maximum effect in the IC50 plots and the levels in the positive controls (FCCP for potential, ionomycin for calcium and tween-20 for nuclear size and permeability) and all the untreated control wells were used as negative controls.
Results
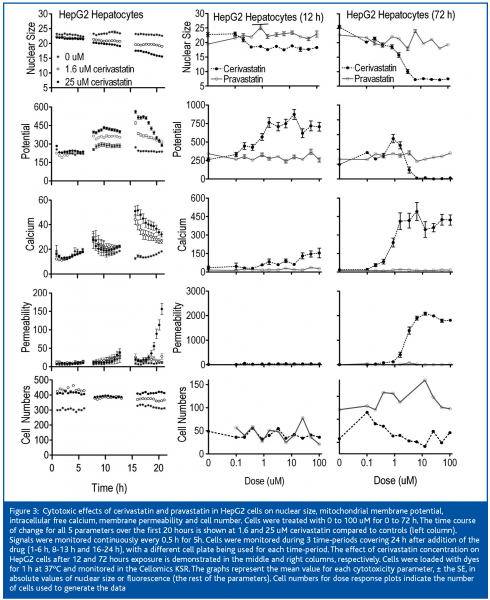
Pravastatin did not induce any detectable changes in HepG2 cells after 3 days of treatment (Figure 3). However, Cerivastatin produced effects within 6 to 8 hours, which became more severe with increased duration of exposure. Cell numbers were not affected within the first 24 hours. Nuclear area was mildly decreased and mitochondrial membrane potential was mildly increased within 6 to 8h of exposure. Calcium was markedly increased between 13 and 16 hours and membrane permeability markedly increased after 16 hours.
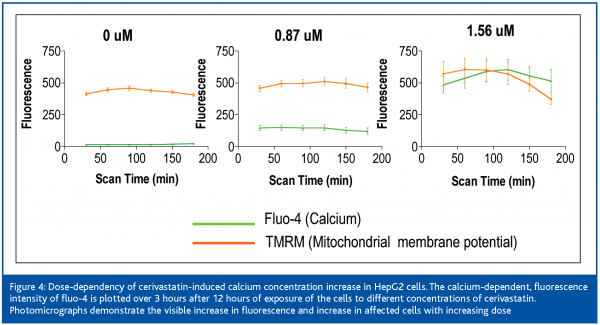
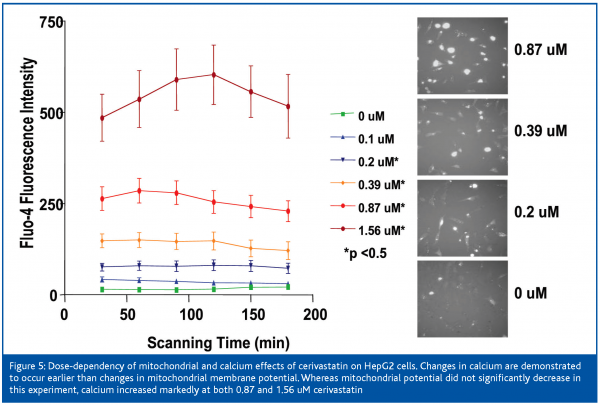
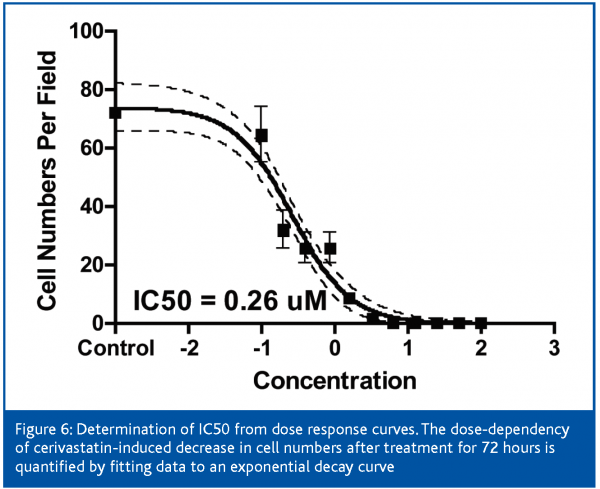
After 12 hours of exposure of the cells to cerivastatin, the nuclear area was decreased and the mitochondrial membrane potential was increased at 0.2 uM, membrane permeability was slightly increased at 0.87 uM, and intracellular free calcium was mildly increased at 1.56 uM and it continued to climb with increased dose. Mitochondrial membrane potential increased to 4-fold control values at 1.56 uM and remained elevated up to the highest dose of 100 uM. Nuclear area decrease at 6.25 uM, intracellular free calcium was mildly increased at 0.2 uM (Figure 3) and rose markedly between 0.87 and 1.56 uM. Mitochondrial membrane potential was mildly increased at 0.87 and 1.56 uM and it collapsed between the latter concentration and 6.25 uM. Membrane permeability was first clearly elevated at 1.56 uM and was markedly increased at concentrations of 3.3 uM and higher. The IC50s for cerivastatin-induced cellular effects were approximately 1 uM for nuclear size and calcium (Table I), which proved to be the most sensitive parameters, followed by mitochondrial membrane potential and permeability. The IC50s for pravastatin were not measurable.
Discussion
Cerivastatin treatment induced a robust increase in intracellular free calcium at low concentrations, which followed a dose-response pattern (Figure 6). An uncontrolled increase in intracellular free calcium is a common final pathophysiological occurrence in severe cell injury, which leads to the activation of calcium-dependent proteases and to the destruction of proteins and lysosomal digestion of cell contents. This rise in intracellular free calcium is attributed to direct injury to the cell membranes or failure of energy supply within the cell9.
In a general sense, calcium overload has been suggested to be the final common pathway in all types of cell death, with increases in intracellular free calcium occurring both at early and late stages of the apoptotic pathway. Calcium release from the ER and subsequent uptake and accumulation into mitochondria is crucial in triggering apoptotic signals. Calcium accumulation into mitochondria contributes to the release of pro-apoptotic molecules (cytochrome C, AIF) into the cytosol, where they activate caspases, which trigger the apoptotic proteolytic cascade. In addition, elevated cytosolic free calcium activates calcium-dependent proteases or calpains, which have a direct impact in the execution of apoptosis10. Disruption of mitochondrial function by itself, can also induce an increase in intracellular calcium11.
Direct evidence that calcium increases are important for apoptosis is illustrated with the use of intracellular calcium buffering agents and extracellular calcium chelators, which can inhibit caspase activation12. Conversely, agents that directly mobilise calcium can trigger apoptosis in diverse cell types13.
Apoptosis can be induced by a loss of calcium homeostasis and it can also be triggered by controlled subtle changes in calcium distribution within intracellular compartments. Although calcium is intimately involved in the regulation of apoptosis, it may not be involved in all forms of apoptosis, since many stimuli induce apoptosis in the absence of any detectable changes in calcium fluxes14.
Cerivastatin induced an early increase in intracellular calcium, although we were unable to determine the mechanism for this increase. Cerivastatin has been shown to cause calcium release from the endoplasmic reticulum, and this increase was in part due to the activation of the ryanodine receptors15. The increase in intracellular free calcium in our system may be due to an alternative mechanism (likely the inositol 1,4,5-triphosphate receptors), since HepG2 cells may not express the ryanodine receptor16. Further support for this proposal is our finding that ryanodine did not induce calcium release in HepG2 cells, and dantrolene (a ryanodine receptor inhibitor) did not block the calcium release induced by the statins (data not shown).
In order to define the sequence of events in cerivastatin-induced hepatotoxicity, we measured the cellular parameters at early time-points after addition of the drug. The early temporal sequence of events can provide information about the possible mechanism of statin-induced toxicity in HepG2 cells. Nuclear area decrease and intracellular calcium increase were early changes occurring before mitochondrial membrane potential, membrane permeability and cell number decreases. Mitochondrial membrane potential was also elevated at an early time-point, reaching levels up to 4-times the control values (Figure 3). This increase in TMRM fluorescence with cerivastatin could perhaps be attributed to an inhibition of p-glycoproteins (P-gp), since statins (although not pravastatin) have been characterised as potent and effective inhibitors of P-gp transporters17. P-gp inhibition could increase the cytosolic concentrations of the statins, thus further exacerbating their effects on cellular biochemistry.
The lack of toxicity of pravastatin, as compared to cerivastatin, might reflect its inability to gain access to the cell by penetrating cellular membranes. Cerivastatin is hydrophobic, and it can easily penetrate lipid bilayers, whereas pravastatin is hydrophilic and this could explain their differential toxicity. In addition, statin intake by hepatocytes takes place through organic anion transporters (OAT), and in particular pravastatin intake is mediated through OAT2, a human-liver specific transporter18. This transporter is not expressed in HepG2 cells, which could explain the lack of toxicity of pravastatin19. In fact, pravastatin does not noticeably inhibit HMG-CoA reductase activity in HepG2 cells, which supports the absence of intake for this drug.
In conclusion, the sequence of events in cerivastatin-induced toxicity in HepG2 cells is indicated. Changes in nuclear area and intracellular calcium occurred first amongst the 5 parameters. These changes are consistent with a pattern of apoptotic cell death. The increase in TMRM fluorescence is also an early event and it is likely to reflect pgp inhibition. Understanding the mechanisms of hepatotoxicity of cerivastatin may provide insight into methods to reduce the side effects of other statins and also optimise their efficacy as anticancer agents. However, further studies are needed to show that the mechanism of hepatotoxicity of other statins is similar to that of cerivastatin.
Acknowledgement
The authors gratefully acknowledge the expert advice and manuscript review by Will Irwin, PhD who worked with CEREP and Pfizer in Sandwich on an associated project.







References
- Thompson, P.D., P. Clarkson, and R.H. Karas, Statin-associated myopathy. Jama, 2003. 289(13): p. 1681-90.
- Jakobisiak, M. and J. Golab, Potential antitumor effects of statins (Review). Int J Oncol, 2003. 23(4): p. 1055-69.
- Marwick, C., Bayer is forced to release documents over withdrawal of cerivastatin. Bmj, 2003. 326(7388): p. 518.
- Marwick, C., Bayer is forced to release documents over withdrawal of cerivastatin. Bmj, 2003. 326(7388): p. 518.
- Laaksonen, R., et al., Decreases in serum ubiquinone concentrations do not result in reduced levels in muscle tissue during short-term simvastatin treatment in humans. Clin Pharmacol Ther, 1995. 57(1): p. 62-6.
- Olson, M.F., A. Ashworth, and A. Hall, An essential role for Rho, Rac, and Cdc42 GTPases in cell cycle progression through G1. Science, 1995. 269(5228): p. 1270-2.
- Giuliano, K.A., Haskins, J.R., and Taylor, D.L., Advances in high content screening for drug discovery. Assay and Drug Development Technologies, 2003. 1(4): p. 565-577.
- O’Brien, PJ, et al. High Concordance of drug-induced human hepatotoxicity with in vitro cytotoxicity measured in a novel cell-based model using high content screening. Archives of Toxicology 2006. In press.
- Warren, J.D., P.C. Blumbergs, and P.D. Thompson, Rhabdomyolysis: a review. Muscle Nerve, 2002. 25(3): p. 332-47.
- Rizzuto, R., et al., Calcium and apoptosis: facts and hypotheses. Oncogene, 2003. 22(53): p. 8619-27.
- McConkey, D.J. and S. Orrenius, The role of calcium in the regulation of apoptosis. Biochem Biophys Res Commun, 1997. 239(2): p. 357-66.
- McConkey, D.J. and S. Orrenius, Signal transduction pathways in apoptosis. Stem Cells, 1996. 14(6): p. 619-31.
- Kaiser, N. and I.S. Edelman, Further studies on the role of calcium in glucocorticoid-induced lymphocytolysis. Endocrinology, 1978. 103(3): p. 936-42.
- Orrenius, S., B. Zhivotovsky, and P. Nicotera, Regulation of cell death: the calcium-apoptosis link. Nat Rev Mol Cell Biol, 2003. 4(7): p. 552-65.
- Inoue, R., et al., Ca (2+)-releasing effect of cerivastatin on the sarcoplasmic reticulum of mouse and rat skeletal muscle fibers. J Pharmacol Sci, 2003. 93(3): p. 279-88.
- Leite, M.F., et al., Nuclear and cytosolic calcium are regulated independently. Proc Natl Acad Sci U S A, 2003. 100(5): p. 2975-80.
- Wang, E., et al., HMG-CoA reductase inhibitors (statins) characterized as direct inhibitors of P-glycoprotein. Pharm Res, 2001. 18(6): p. 800-6.
- Cohen, L.H., et al., Pravastatin inhibited the cholesterol synthesis in human hepatoma cell line Hep G2 less than simvastatin and lovastatin, which is reflected in the upregulation of 3-hydroxy-3-methylglutaryl coenzyme A reductase and squalene synthase. Biochem Pharmacol, 1993. 45(11): p. 2203-8.
- Nakai, D., et al., Human liver-specific organic anion transporter, LST-1, mediates uptake of pravastatin by human hepatocytes. J Pharmacol Exp Ther, 2001. 297(3): p. 861-7.


