HTS technologies to facilitate chemical genomics
Posted: 27 March 2007 | | No comments yet
Industrial scale technologies developed and applied within the pharmaceutical industry for the purpose of drug discovery have recently been adopted by many research laboratories for the purpose of facilitating chemical genomics. Taking full advantage of these technologies will require education in high-throughput screening assay systems as well as new methods that exploit the capabilities of existing technologies.
Industrial scale technologies developed and applied within the pharmaceutical industry for the purpose of drug discovery have recently been adopted by many research laboratories for the purpose of facilitating chemical genomics. Taking full advantage of these technologies will require education in high-throughput screening assay systems as well as new methods that exploit the capabilities of existing technologies.
Industrial scale technologies developed and applied within the pharmaceutical industry for the purpose of drug discovery have recently been adopted by many research laboratories for the purpose of facilitating chemical genomics. Taking full advantage of these technologies will require education in high-throughput screening assay systems as well as new methods that exploit the capabilities of existing technologies.
The use of small molecule compound collections to obtain starting points for drug discovery has been practiced for more than one hundred years within the pharmaceutical industry1. However, it has only been relatively recently that the methodologies utilised to develop small molecules into therapeutics have been adopted by the academic sector as a means to produce general research tools that are useful to perturb biology and uncover mechanisms of biological function2,3. A groundbreaking initiative in this area was the Harvard Institute of Chemistry and Cell Biology (ICCB), founded by Mitchison and Schreiber in 1997. (http://www.hms.harvard.edu/news/releases/697cellinst.html). The term ‘chemical genomics’ is now widely used in reference to identifying compounds that act as positive or negative regulators of individual gene products or signaling pathways to further the understanding of biological networks and cellular phenotypes4,5. In 2003 the U.S. National Institutes of Health (NIH) as part of the NIH Roadmap for Medical Research (http://nihroadmap.nih.gov) started the Molecular Libraries Initiative (MLI) to provide high-throughput screening technologies and chemical probes for basic research6. This effort was largely motivated by the need to determine the function of the large number of genes identified by the Human Genome Project, and the unique role of small molecules as physiological regulators of protein function7. The screening component of the MLI, the Molecular Libraries Screening Centers Network (MLSCN), was initiated in June of 2004, and is now composed of ten screening centres that are complementary in technologies and throughput. The MLSCN centres optimise and screen assays submitted by investigators against a large collection of compounds and perform optimisation chemistry to achieve agreed properties of potency and activity that credits them as in vitro ‘chemical probes’ 6,8 (see also http://mli.nih.gov). Importantly, both chemical and biological information is now accessible to the public sector through the creation of databases9 such as PubChem (another component of the NIH MLI – http://pubchem.ncbi.nlm.nih.gov) and ChemBank (http://chembank.broad.harvard.edu). This article focuses on two key aspects that will be critical to the success of these initiatives: the need for education on the tools and technologies required to bring complex biological components into assay formats that can be screened against large (>100K) compound collections and the need to provide robust datasets that can be mined for structure-activity relationships (SAR). How these two key aspects are being addressed at the NIH Chemical Genomics Center (NCGC), the one intramural center of the MLI, is illustrated below.
A need for education
The processes pioneered within the pharmaceutical community to manage and screen large compound collections are complex and include low-volume liquid handling, large scale maintenance of cell lines, sensitive and specialised detection technologies, methods for quality control of both biological and chemical reagents, robotic automation, databases to track and annotate compounds, informatics tools to analyse results and integrated enzymology and pharmacology. Furthermore, automated assay formats developed early in the screening phase should be robust enough to support SAR work that could last 3-5 years when the goal is identifying a candidate suitable for clinical studies. As with many cross-disciplinary fields, the practice of assay development and HTS utilises a significant amount of institutional memory or ‘tribal knowledge’ that only apprentices of the field are privy to. Therefore, central to the success of the public efforts in chemical biology and drug discovery is education of the research community in the know-how required to convert biological concepts into assays that can be implemented in high-throughput screening systems10,11.
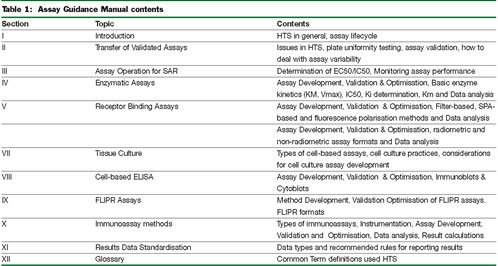
With this in mind, there are now several resources where investigators can obtain such information. The Molecular Libraries Initiative web site (http://mli.nih.gov/) has links to guide investigators wishing to develop or submit assays to the MLSCN. At the NCGC we have published an Assay Guidance Manual (AGM available online at http://www.ncgc.nih.gov/guidance/index.html) that was largely developed by researchers at Eli Lilly and Company. The AGM is intended to provide standardised best practices for those who are beginners as well as experienced practitioners of HTS. Examples in various chapters describe how the biological principles, bioanalytical methods and statistical concepts are incorporated to develop robust assay methodologies capable of measuring biological activities of compounds in large chemical libraries.
Table I summarises the AGM chapter contents and how these relate to the process of using small molecules in HTS applications. The first chapters of this manual cover the process of assay optimisation and statistical validation with an introduction to performance factors for judging the quality of an assay. Basic metrics of assay performance such as signal:background, signal:noise, signal window and Z-factors are discussed12. Procedures for determining within run and between run assay variability are also given. These are followed by a chapter describing the use of an assay to follow structure-activity relationships (SAR) of a chemical series during chemical optimisation. In this chapter, example curve-fitting procedures are also shown. Relevant statistical values such as the minimum significant ratio (MSR13) useful for gaining an understanding of the variability around the potency determinations of compounds are introduced. Following these are specific examples of both cell-free and cell-based assays and steps to ensure that these assays are pharmacologically validated. The principles of cell-free assays are illustrated using prototypical enzyme assays including the process of determining critical parameters such as Km and Vmax and optimisation of substrate and enzyme concentrations. The relationship between Ki and IC50 are also illustrated. Additionally, cell-free assays involving isolated membranes or proteins are further illustrated in a chapter on ligand-displacement binding. Classical equations for determining Kd and Bmax are given as well methods for determining non-specific binding. This is illustrated with both classical radio-ligand binding assays as well as the use of competition-based fluorescent polarisation assays. The proper use of equations to correct IC50s to Kd’s from these experiments is shown, as are some typical assay artifacts that occur in both radioligand and fluorescent assays. An intermediate assay type is a system that uses isolated cellular components or reconstituted systems to measure a functional response. With this in mind, a chapter dealing with isolated membranes to quantify GTPγS binding as a means to measure functional responses from GPCRs is discussed with assay protocols. Moving to cell-based assays is a chapter covering the best practices of handling and maintenance of cell lines. This is followed by several chapters illustrating specific examples of cell based assays including cell-based ELISA, immunoassays and FLIPR. Embedded throughout the manual are links to spreadsheets for performing calculations as well as references. Finally, a glossary of common terms and definitions is provided.
The AGM also stresses that the reagents used to develop the assays, such as the target enzymes, substrates, radioligands, membrane preparations and cell lines must be rigorously purified and/or characterised for the intended biological activity. Similarly, these reagents should tolerate 0-10% DMSO concentrations in the final assay format, since DMSO is the universal solvent of choice for compound dissolution.
New applications of HTS technologies
Current HTS technologies are capable of generating >100,000 data points in a single day. Such efficiency has been typically leveraged to enhance the throughput of assays across large chemical libraries. However, strategic changes aimed at developing screens of higher informational value are resulting in adapting these technologies toward the generation of robust datasets where the data points are concentrated on a set of assays or focused set of compounds14. Such information can be used to deduce SAR by measuring pharmacological descriptors such as AC5035 and efficacy. An emerging theme in small molecule discovery is profiling the biological activities of compounds through multiple analytical biological assays15, recognising that that compounds rarely act on a single molecular target, but instead have multiple interactions16. This shift has been enabled by advances in technologies for screening large chemical libraries as well as high content imaging formats17-19. For example, a recent report showed the use of advanced screening technologies to collect concentration-response profiles for a set of 1,400 compounds across 35 cell-based assays in a single experiment20. Alternatively, multi-dimensional screening approaches can be used to profile a set of compounds across many phenotypic assays using cell lines of different genotypes21.
In this context the emphasis is not simply on identifying an active substance, where a certain level of false positives and negatives can be tolerated, but rather to collect datasets that can be used to draw conclusions on how each compound is affecting the biological system or pathway being studied. Such datasets can be used to identify mechanisms of ‘off-target’ effects within a structurally related series or ‘hidden phenotypes’ where common biological activities are revealed within a structurally unrelated series of compounds, a procedure that is greatly facilitated by the use of cell-based systems sharing a common assay format22,23. Additionally, the data can be further mined to aide in the construction of compounds or libraries with improved activity for the particular system being studied or alternatively to address areas of inactivity within the library.
Another new approach is the use of 3-D cultures for phenotypic HTS which is quite compatible with high density plate formats. Screening with cells grown under 3-D culture conditions might increase the likelihood that the biological and pharmacological modulation observed after compound treatment is physiologically and clinically relevant. For example, the multicellular tumour spheroid model (MCTS) (for review see Kunz-Schughart et al.24) mimics the morphological, functional and mass transport characteristics of the tumour tissue in vivo. The presence of the extracellular matrix in MCTS provides types of cell-to-cell and cell-to-matrix interactions that are absent in typical 2-D cultures used in conventional screens. Similar 3-D systems are being tested for drug screening applications outside cancer research and may prove to be valuable for improving the prediction of in-vivo effects from in vitro results25. However, in order for advances in HTS technologies such as these to address the many challenges faced by chemical genomics in identifying chemical probes across the genome, they must be coupled with new, more informative screening paradigms.
qHTS: The NCGC paradigm
At the NIH Chemical Genomics Center (NCGC) we are employing the most recent advances in low-volume liquid handling and robotic screening systems to enable both the identification of chemical probes for the currently ‘undruggable genome’ and the creation of a public database that can be used for biological activity profiling. For this purpose, biological systems are assayed against small molecule libraries containing ~100K compounds at 7-15 concentration points and concentration-response (CR) curves are then generated for every compound in the library – a process called quantitative HTS26.
To create the concentration titration series needed for qHTS, compounds contained in DMSO are first diluted across a series of 384-well plates and then reformatted by interleaved quadrant transfer to 1536-well plates. Conditions of tip washing between plate transfer must be optimised to ensure that there is no carry over of contaminating compound from plate to plate. The screening deck then consists of 1536-well compound source plates that are plated at seven or more concentrations spanning 640 nM to 10 mM in DMSO. Using a 1536-well pin tool27 20 nL of compound solution is transferred from the source plates into the assay plates that typically contains an assay volume of between 2 and 5 uL/well. Several advantages are realised by creating the dilution series between plates as opposed to titrating each compound within the same plate. These include flexibility in the choice of concentration range as the titration point can be customised based on assay sensitivity and availability of reagents, and asymmetric titrations screens can be easily performed. The inter-plate format increases the resilience of a screen because obtaining CR curves is refractory to single plate failures that can occur when hundreds of plates are screened in an automated fashion. Additionally, artifacts that can result from ‘carry-over’ from the pin-tool are readily identified using the interplate dilution format because the plates are screened from low to high concentration.
Following compound plating and dilution, compounds are assayed at multiple concentrations to construct CR curves (Figure 1). The process first involves plate normalisation that employs DMSO blanks present within the assay run to correct for background signatures due to tip dispensing and other screening artifacts. Then curve fitting using the Hill equation is performed and the CR curves are classified according to the quality of the fit to the data, number of asymptotes and efficacy of the response.
For ease of analysis, we have classified CR curves into four types (Figure 1b): Class 1 curves are complete containing both upper and lower asymptotes; they can be further subdivided by the efficacy of the response. Class 2 curves are incomplete with one of the asymptotes missing; these can also be subdivided based on the efficacy of the response. Class 3 curves are of the lowest confidence as they are fitted only to the highest concentration point tested. Finally, Class 4 curves are inactive compounds where a concentration-effect relationship is absent. The level of acceptable activity is set based on the standard deviation (SD) of assay signal obtained at the lowest tested concentration and is typically set between 3 and 6 SD. Additionally, each class is further subdivided based on the quality of the curve fit to the data (r2). Two pieces of information are readily derived from this single experiment. First, the pharmacological profile of every compound member is available. Parameters derived from the curve fitting such as AC50, efficacy and Hill slope can then be used as descriptors of the compound when comparing a chemical series within the same assay or across assays.
In qHTS, an active chemical series is identified by clustering the structures based on the highest quality curve classes (Classes 1 and 2). The chemical clusters that result from this analysis can then be used to query the entire compound collection so that weakly active (e.g. Class 3 curves) and inactive (Class 4) analogs are identified as well (Figure 2). Therefore the SAR for a chemical probe series is fully available enabling prioritisation and chemical optimisation strategies to originate directly from the primary screening dataset. Importantly, the identified inactive analogs can be used to further enhance the understanding of the SAR as well as serve as negative controls for subsequent secondary assays. As well, the bioactivity profile for each chemical series is available across all assays that have undergone qHTS (Figure 2).
For the curve classification it is interesting to note that neither potency nor Hill slope are initially used. The reason for disregarding potency in the classification can be seen in Figure 3 where a set of CR curves are shown with similar apparent AC50s (between 1 and 3 uM) but with very different concentration-effect curves. For example, both Class 1a curves with efficacies >80% of control as well as Class 1b curves where the efficacy can be as low as 30% of control are found. Additionally, data where the curve fitting resulted in lower r2 values or the upper asymptote is missing are found within this example dataset. The apparent AC50 is not reflective of these different behaviours. The use of Hill slope as a criterion to classify curves is complicated by the fact that the underlying mechanisms determining the Hill slope is often not understood. Although steep Hill slopes in cell-free assays can be an indicator of artificial behavior such as compound aggregation, it is possible to obtain steep CR curves for genuinely active inhibitors (for a recent commentary on this subject see Shoichet28). For cell-based assays Hill slopes > 1 can be particularly common especially for functional assays. Therefore, to properly capture such responses we chose to classify curves solely based on the efficacy (response magnitude), presence of asymptotes and goodness of the curve fit to the data (r2). Additional parameters such as AC50 and Hill slope are then used in subsequent SAR analysis.
Experience at Eli Lilly and Company has shown that many single-point medium throughput screens (MTS) or screens with focused libraries can generate high hit rates that exceed standard confirmation routes. Recent screens have yielded active rates in the 10% range (10,000 compounds in a 100,000 compound screen); thus necessitating a change in actives confirmation paradigm. Actives confirmation practices and associated standard protocols for generating IC50’s, 10 point titrations within a single plate, tend to be time and robotic intensive propositions. A typical approach is to order compounds from sample management (8 compounds in a 96-well plate) and serially dilute using a TECAN or similar automation. A standard 10-point dilution scheme can take approximately three minutes (no tip change) to approximately 7 minutes if tips are changed. Stamping four 96-well plates to a single 384-well plate takes a further 3 minutes (with tip washing). Using these values, generating serial dilutions for 320 compounds takes a minimum of 150 minutes and consumes forty 96 well plates. Experience with qHTS dilution paradigm (inter-plate dilution) has shown that one can successfully dilute 320 compounds in less than 5 minutes using the standard Rapid 320 or Rapid 80 format plates that Eli Lilly receives from sample management for hit confirmation. The time and cost savings, and the ability to evaluate different classes of activity curves, make the qHTS paradigm considerably attractive. Assay performance evaluation in this new format has shown that AC50 values to be within the MSR for the same assay run in the standard dilution paradigm (see Applications of qHTS below).
Figure 4a shows some typical timelines for a conventional single-concentration-based screen. Note that the ‘cost of delay’ between a single point screen and the related confirmation of actives process is not only labour intensive but also expensive as it requires evaluating the actives by experienced computational and medicinal chemists as well as subsequent processing by sample management groups. This burden can be quite significant and can be easily modeled based on internal cost structure although this may vary among various screening labs. When one compares HTS to qHTS in terms of cost and time there are a few general trends that are apparent (Figure 4b). As qHTS determines all the CR curves in one experiment the cost/time burden is independent of hit rate and remains the same at any hit rate. However, hit rate greatly affects the cost and time required to obtain CR of actives in HTS. While the total cost for qHTS are higher for low hit rate assays (<1%) this approach shows much lower costs for high hit rate assays with a break-even point near intermediate hit rates. Additionally for low-hit rate assays (<1%) the time for confirmation from HTS can be close to qHTS, but this advantage is rapidly lost as the hit rate increases. Also, the cost per AC50 drops with increasing hit rate in HTS due to an economy of scale but the cost per AC50 is lower and constant for qHTS because CR curves are determined for every compound in the library in one experiment. None of the analysis presented above considers the cost of missing active compounds (e.g. false negatives) an issue that is addressed by qHTS. In particular, low efficacy compounds or compounds possessing complex concentration-effect relationships can be missed with traditional HTS. This point is further illustrated below.
Applications of qHTS
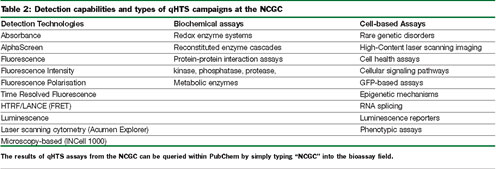
The qHTS approach has been successfully applied to a variety of screening formats at the NCGC (Table 2). In particular, the ability to run cell-based assays with fluorescent protein reporters in a high-content mode has been enabled by integration of laser scanning microplate cytometry (Acumen Explorer29) into the 1536-well based liquid handling systems at the NCGC. This has been applied to measure protein-complementation, gene expression and protein translocation assays. Successful 1536-well cell-based assays require the right liquid handlers and associated technologies. For this purpose we use solenoid-based dispensers from Beckman (Aurora, Flying Reagent Dispenser30) or from Kalypsys. Additionally, stainless steel rubber gasketed-sealed lids are used to cover both compound and assay plates to retard evaporation31.
Iversen et al.12 has pointed out that typical statistical parameters such as Z-factor and signal window are not adequate to judge the quality of CR based assays such as qHTS. In this regard the MSR value has been suggested as a possible quality control parameter because it pertains to the reproducibility of potency values. Currently at the NCGC intra-plate titrations are included in the control wells of many assays to calculate baseline MSR values for the assay. We have found this useful when comparing AC50 values derived from the qHTS. When the same reference compound is tested at least once in every assay run, control charting techniques can be used to monitor assay performance over time. Control charting is used to detect unusual runs that may need to be repeated and to determine when the assay is drifting away from the expected result for the reference compound(s)32. Duplicate or triplicate qHTS measures of the same sub-library can also be used to evaluate the reproducibility of CR curves within an assay26. Therefore at the NCGC, we typically incorporate replica determinations of a sub-library containing annotated bioactive compounds (such as LOPAC) for quality control of the qHTS. Overall, we have found that the qHTS format extends the useful range of assays that can be run in a miniaturised format. For example, one 1536-well assay that involved online washing and fixing of cells possessed a Z-factor of only 0.3 although high-quality concentration response curves were still obtainable33.
At Eli Lilly and Company a comparison was performed between inter-plate titrations of compounds as in qHTS to traditional intra-plate titrations. To validate the equivalency of the CR curves generated by qHTS and traditional dose responses, a comparison of EC50 values for a cell-based reporter assay was performed using both inter-plate and intra-plate dilution protocols. In this analysis, the EC50s generated from an inter-plate dilution using a 384 format were compared to EC50s generated in a traditional dose response in media using a 96-well format. Despite these differences in methodology, there was a good comparison between the EC50 values (1.6 average fold difference between methods) and a good rank order correlation (r2=0.853).
For assays such as cell-free enzyme assays where a single CR curve is generated for every compound the classification of curves is straightforward. However, the use of multiple reporters or high-content screening systems can result in multiple CR curves generated from each compound. When imaging-based assays are employed the number of CR curves per compound can rapidly escalate. For example, at the ICCB a multidimensional profile was generated for 100 compounds by measuring CR curves using eleven different imaging probes in a cell-based assay that employed an automated microscope system18.
An example of a complex cell-based assay run in qHTS at the NCGC is given by an assay performed to search for stabilisers the IÎB· protein within a human lymphoma cell line. The assay format employed the use of a two colour dual luciferase reporter system where three CR curves (green luminescence (G’), red luminescence (R’) and their ratio (G’/R’) were generated for each compound34. Therefore, a set of three CR curves was generated for every compound and these showed complex interdependence. For example, a decline at high compound concentrations was observed in the R’ signal for some active compounds, giving rise to artificial rises in the G’/R’ dataset. In this case, in addition to the evident category of ‘Inactive’, we used a set of rules to categorise each set of curves into three categories: IÎB· Stabilisers, Signal Activators and Signal Inhibitors (Figure 5). The categorisation was performed by first classifying the set of CR curves obtained for every compound using the four curve classes described above. This resulted in a numerical value for each of the datasets such as ‘1’ for a high quality complete curve showing signal activation or ‘-1’ for a high quality complete curve showing signal inhibition. These numerical values could then be used to automatically sort the compounds into the four categories based on the CR behaviour for all three datasets.
Another source of complexity in cell-based assays is the presence of non-sigmoidal CR curves. As shown in Figure 6, bell-shaped curves can be particularly prevalent in such assays. In this case the CR curves are characterised by three major regions: biological inactivity where the compound concentration is too dilute for an observed effect, biological efficacy where the effect is observed within an often narrow concentration range and biological toxicity where the compound concentration is sufficiently high so that many antagonistic effects resulting in cytotoxicity are observed. Such diverse and complex compound behavior can result in false negatives when conventional HTS approaches are applied. This emphasises the need for titration-based screening to properly characterise a compound as active or inactive.
The success of any screening paradigm, whether by traditional or qHTS approaches, depends on the availability of high quality assays that have been properly developed and validated for HTS. Therefore, there needs to be continued outreach by those trained in this discipline to guide the development of assays by investigators unfamiliar with this area of applied science. Such assays can be applied to miniaturised formats and industrial scale screening systems. At the NCGC we have developed qHTS and use such screening systems to apply this approach to every assay. This data provides a bioactivity profile for a chemical library that is publicly available within PubChem. As such it will serve the research community in determining compound behaviour across a variety of biological processes as well as a database for secondary assays and counter-screens.
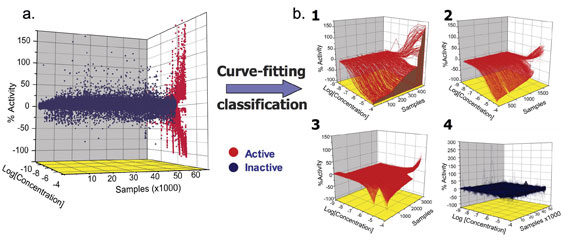

Figure 1: qHTS process and results a) A 3D-scattergram of the CR data. Shown is data from the pyruvate kinase/luciferase coupled assay26. Data lacking (blue) or showing (red) concentration-response relationships is shown for the 60,793 samples tested; b) Inhibitory and stimulatory compounds are shown following curve classification; (1) complete curves (Class 1) displaying full and partial activity; (2) Incomplete curves (Class 2) for inhibitors and activators having AC50s within and beyond the tested titration range and (3) Incomplete inhibitory and stimulatory curves that are fitted to a single point (Class 3) and (4) Inactive samples that do not show any concentration-response relationship (Class 4)
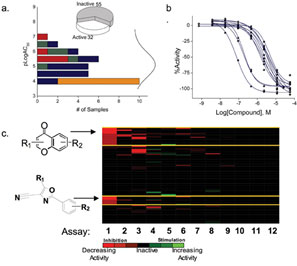

Figure 2: SAR and bioactivity profile information from qHTS a) Potency distribution for a phenyl-cyano-oxazole series (see lower structure in c.) identified in the pyruvate kinase/luciferase coupled assay. The fraction of compounds in each curve class is shown with Class 1b (>80% efficacy, red), Class 1a (<80% efficacy, green), Class 2 (blue) and Class 3 (orange). The inset shows the number of active and inactive analogs within this series; b) Example CR curves for actives within the phenyl-cyano-oxazole series derived from the qHTS; c) Bioactivity profile of the phenyl-cyano-oxazole series (lower structure) compared to another active series of flavanoids (upper structure). Heat map is coloured by curve class with the brightest red = Class 1 inhibitors and the brightest green = Class 1 activators. The first assay is the pyruvate kinase/luciferase coupled assay used to identify the series. The flavonoids show some strong inhibitory activity in Assay 2, that was an assay with luciferase alone. Additional activity is observed in other assays for the flavanoid series that is not seen for the phenyl-cyano-oxazole series, thus providing valuable selectivity information for these two series
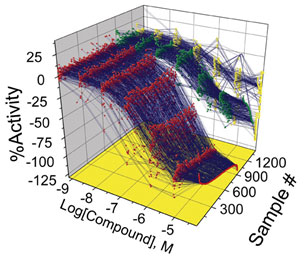

Figure 3: Concentration-response curves of different response and qualities showing similar apparent AC50s. Shown are a set of CR curves with AC50s of between 1 and 3uM. Data points with blue wire frames drawn through them are shown for each curve set. Red data points, Class 1a, complete concentration response curves showing full efficacy (>80% of control); green data points, Class 1b complete concentration response curves with partial efficacy curves (<80% of control); yellow data points, Class 2, incomplete curves lacking an upper asymptote and differing in curve fit quality
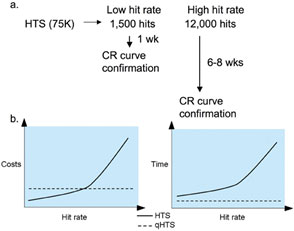

Figure 4: Impact of hit rate on cost and time for HTS and qHTS a) HTS (single concentration screening) process shown for an intermediate hit rate (2%) and a high rate (20%) screen. The time to obtain an 11-point concentration response curve involves evaluation by medicinal and computational chemist, ordering of compounds from a central sample management group, cherry picking, compound preparation and delivery of the actives; b) HTS (solid lines) and qHTS (dashed lines). Both time and cost can be greatly affected by hit rate in HTS while both cost and time are constant in qHTS as the confirmation of AC50s is performed in a single experiment. Left, cost estimates with lines showing total cost (primary screen plus cherry picking and confirmation steps). The right graph represents total time for AC50 confirmation. Information was derived based on a model using a 75,000 member compound collection with the hit rate varying from 0.2% (left) to 20% (right). A 1536-well assay was assumed for both approaches. Time estimates include primary screening time (one or multiple concentrations) and for HTS the required confirmation steps as described in Figure 4a
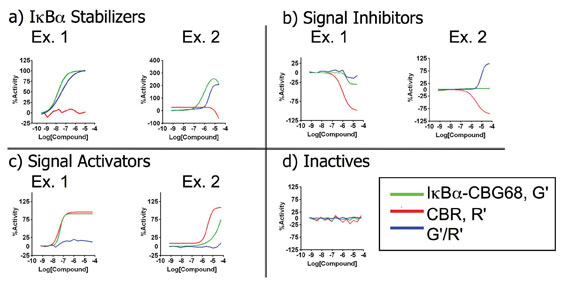

Figure 5: Complexities of concentration-response curves derived from a multiplexed dataset and their categorisation Shown are four categories derived from a two colour dual luciferase assay where red luminescence and green luminescence as well as their ratio was measured to assay for stabilisers of IÎB·34. In this assay the IκBα is fused to a green emitting luciferase while an unfused red emitting luciferase is present in the same cells to act as a reporter of cell uniformity. Illustrated here (adopted from Davis34) are the four categories of CR curves that were observed based on the concentration-responses of all three data sets. a) IκBα Stabiliser category, where green luminescence and the ratio data set increase. Red luminescence may decrease at high compound concentrations (example 2) leading to bell-shape curves; b) Signal Inhibitors category, where both green and red luminescence show inhibitory concentration response curves and inactivity in the ratio dataset (example 1) or inhibitory CR curve in the red luminescent with an increase in the ratio dataset (example 2); c) Signal Activators category, where red and green luminescence increase to near equal levels leading to inactivity in the ratio dataset (example 1) or red luminescence increases to a greater degree than the green luminescent (example 2); d) Inactive category, where no concentration dependence was observed in all three datasets. Graphs shown are fits to data or lines drawn through the data points for example compounds identified in qHTS
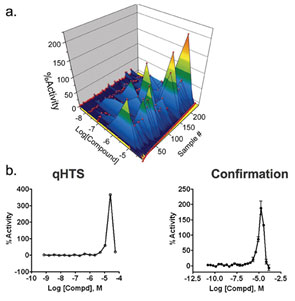

Figure 6: Complex concentration response curves observed in a cell-based qHTS campaign a) A series of bell-shaped CR curves are represented as a surface map with data points shown in red. Also shown is data observed for the ratiometric (G'/R') dataset in the IkBa assay performed by the NCGC (PubChem AID: 445); the G'/R' ratio was calculated from the green luminescence arising from the IkBa-green luciferase fusion/red luminescence arising from an unfused luciferase; b) An example of a bell-shaped curve for the IkBa assay obtained for the compound Ebselen. Shown are the primary qHTS data and subsequent confirmation data (24 concentration-titration points) obtained from re-supplied compound


References
- Drews J. Drug Discovery: A Historical Perspective. Science. 2000.287(5460): p.1960-1964
- Stockwell BR. Frontiers in chemical genetics. Trends Biotechnol. 2000.18(11): p. 449-455.
- Stockwell BR. Chemical genetics: ligand-based discovery of gene function. Nat. Rev. Genet. 2000.1(2): p.116-25.
- Collins FS, Green ED, Guttmacher AE, Guyer MS. A Vision for the Future of Genomics Research, Nature 2003.422(6934): p.835- 847.
- Spring DR. Chemical genetics to chemical genomics: Small molecules offer big insights Chem. Soc. Rev. 2005.34: p. 472-482.
- Austin CP, Brady LS, Insel TR, Collins FS. NIH Molecular Libraries Initiative. Science 2004.306(5699): p.1138-1139.
- Austin, CP. The completed human genome: implications for chemical biology. Curr. Opin. Chem. Biol. 2003.7: p. 511-515.
- Lazo JS. Roadmap or Roadkill: A Pharmacologist’s Analysis of the NIH Molecular Libraries Initiative. Molecular Interventions 2006.6(5): p. 240-243.
- Richard, AM, Gold, LS, Nicklaus MC. Chemical structure indexing of toxicity data on the Internet: Moving toward a flat world. Curr. Opion. Drug Disc. Dev. 2006.9(3): p. 314-315.
- Soderholm J, Uehara-Bingen M, Wies K, Heald R. Challenges facing the biologist doing chemical genetics. Nat. Chem. Biol. 2006.2(Feb): p.55-58.
- Begley TP. Chemical biology: an educational challenge for chemistry departments. Nat. Chem. Biol. 2005.1(Oct): p.236-238.
- Iverson PW, Eastwood BJ, Sittampalam GS, Cox KL. A comparison of assay performance measures in screening assays: Signal Window, Z factor and assay variability ratio. J. Biol. Screening 2006.11(3): p.247-252.
- Eastwood BJ, Farmen MW, Iversen PW, Craft TJ, Smallwood JK, Garbison KE, Delapp NW, Smith GF. The Minimum Significant Ratio: A Statistical Parameter to Characterize the Reproducibility of Potency Estimates from Concentration-Response Assays and Estimation by Replicate-Experiment Studies. J. Biomol. Screening 2006.11(3): p. 253–261.
- Fox S, Farr-Jones S , Sopchak L, Boggs A, Nicely HW, Khoury R, Biros M. High-throughput screening: Update on practices and success. J. Biomol. Screening 2006.11(7): p. 864-869.
- Stockwell BR. Exploring Biology with small organic molecules 2004.432(7019): p.846-854.
- Van Huijsduijnen RH, Rommel C. Decompartmentalizing target validation-thinking outside the pipeline boxes. J. Mol. Med. 2006.84(10): p. 802-813.
- Talyor DL, Haskins JR, Giuliano KA editors in High Content Screening: A powerful approach to systems cell biology and drug discovery. Humana Press. Totowa, NJ 2007.
- Perlman ZE, Slack MD, Feng Y, Mitchison TJ, Wu LF, Altschuler SJ. Multidimensional drug profiling by automated microscopy. Science 2004.306(5699): p.1194-1198.
- Eggert US, Mitchison TJ. Small Molecule screening by Imaging. Curr. Opin. Chem. Biol. 2006.10: p. 232-237.
- Melnick JS, Janes J, Kim S, Chang JY, Sipes DG, Gunderson D, Jarnes L, Matzen JT, Garcia ME, Hood TL, Beigi R, Xia G, Harig RA, Asatryan H, Yan SF, Zhou Y, Gu XJ, Saadaat A, Zhou V, King FJ, Shaw CM, Su AI, Downs R, Gray NS, Schultz PG, Warmuth M, Caldwell JS. An efficient rapid system for profiling the cellular activities of molecular libraries. Proc. Natl. Acad. Sci. USA. 2006.103(9): p. 3153-3158.
- Ramanathan A, Wang C, Schreiber S. Perturbational profiling of a cell-line model of tumorigenesis by using metabolic measurements. Proc. Natl. Acad. Sci. USA 2005.102 (17): p. 5992-5997.
- Yu H, West M. Keon BH, Bilter GK, Owens S, Lamerdin J, Westwick JK. Measuring drug action in the cellular context using protein-fragment complementation assays. Assay Drug Dev.Technologies. 2003.1(6): p.:811-822
- MacDonald ML, Lamerdin J, Owens S, Keon BH, Bilter GK, Shang Z, Huang Z, Yu H, Dias J, Minami T, Michnick SW, Westwick JK. Identifying off-target effects and hidden phenotypes of drugs in human cells. Nat. Chem. Biol. 2006.2: p. 329-337.
- Kunz-Schughart LA, Freyer JP, Hofstaedter F, Ebner R. The Use of 3-D Cultures for High-Throughput Screening: The Multicellular Spheroid Model. J.Biol. Screening. 2004:9(4): 273-285.
- Reininger-Mack A, Thielecke H, Robitzki AA. 3-D biohybrid Systems: Applications in Drug Screening. Trends. Biotechnol. 2002.20(2): p.56-61.
- Inglese J, Auld DS, Jadhav A, Johnson, RL Simeonov A, Yasgar A, Zheng W, Austin C. Quantitative High-Throughput Screening (qHTS): A Titration-based Approach that Efficiently Identifies Biological Activities in Large Chemical Libraries. Proc Natl Acad Sci 2006.103(31): p.11473-11478.
- Cleveland PH, Koutz PJ. Nanoliter Dispensing for uHTS Using Pin Tools. Assays Drug Dev. Technologies. 2005.3(2): p. 213-225.
- Shoichet BK. Interpreting Steep Dose-Response Curves in Early Inhibitor Discovery. J. Med. Chem. 2006.49(25): p. 7274-7277.
- Bowen WP, Wylie PG. Application of Laser-Scanning Fluorescence Microplate Cytometry in High Content Screening. Assays Drug Dev. Technologies 2006.4(2): p. 209 -221.
- Niles WD, Coassin PJ. Piezo- and Solenoid Valve-Based Liquid Dispensing for Miniaturized Assays. Assays Drug Dev.Technologies. 2005.3(2): p.189-202.
- Mainquist JKD, Robert C, Weselak, MR, Meyer AJ, Burow KM, Sipes, DG, Caldwell, J. (2003). Specimen plate lid and method of using. US Patent # 6534014.
- Montgomery, DC. Introduction to Statistical Quality Control, Fifth Edition. Wiley, New York. 2004.
- Auld DS, Johnson RL, Zhang Y, Veith H, Jadhav A, Yasgar A, Simeonov A, Zheng W, Martinez ED, Westwick JK, Austin CP, Inglese J. Fluorescent Protein-based cellular assays analyzed by laser scanning microplate cytometry in 1536-well plate format. Meth. Enzymol. 2006.414: p. 566-589.
- Davis RE, Zhang Y-Q, Southall N, , Staudt LM, Austin C, Inglese J, Auld DS. A cellular assay for IÎB· stabilization using a two-color dual luciferase-based sensor. Assays Drug Dev. Technologies. 2007.5(1): p. 85-103.
- The AC50 is the concentration that gives 50% activity. It is analogous to IC50 or EC50 except that the AC50 is agonistic to the direction of the curve (upward or downward modulation of the signal). Use of this convention is recommended to facilitate global standardisation of screening data reporting and publication.


